 01
01What is happening in the world?
From the news back to life
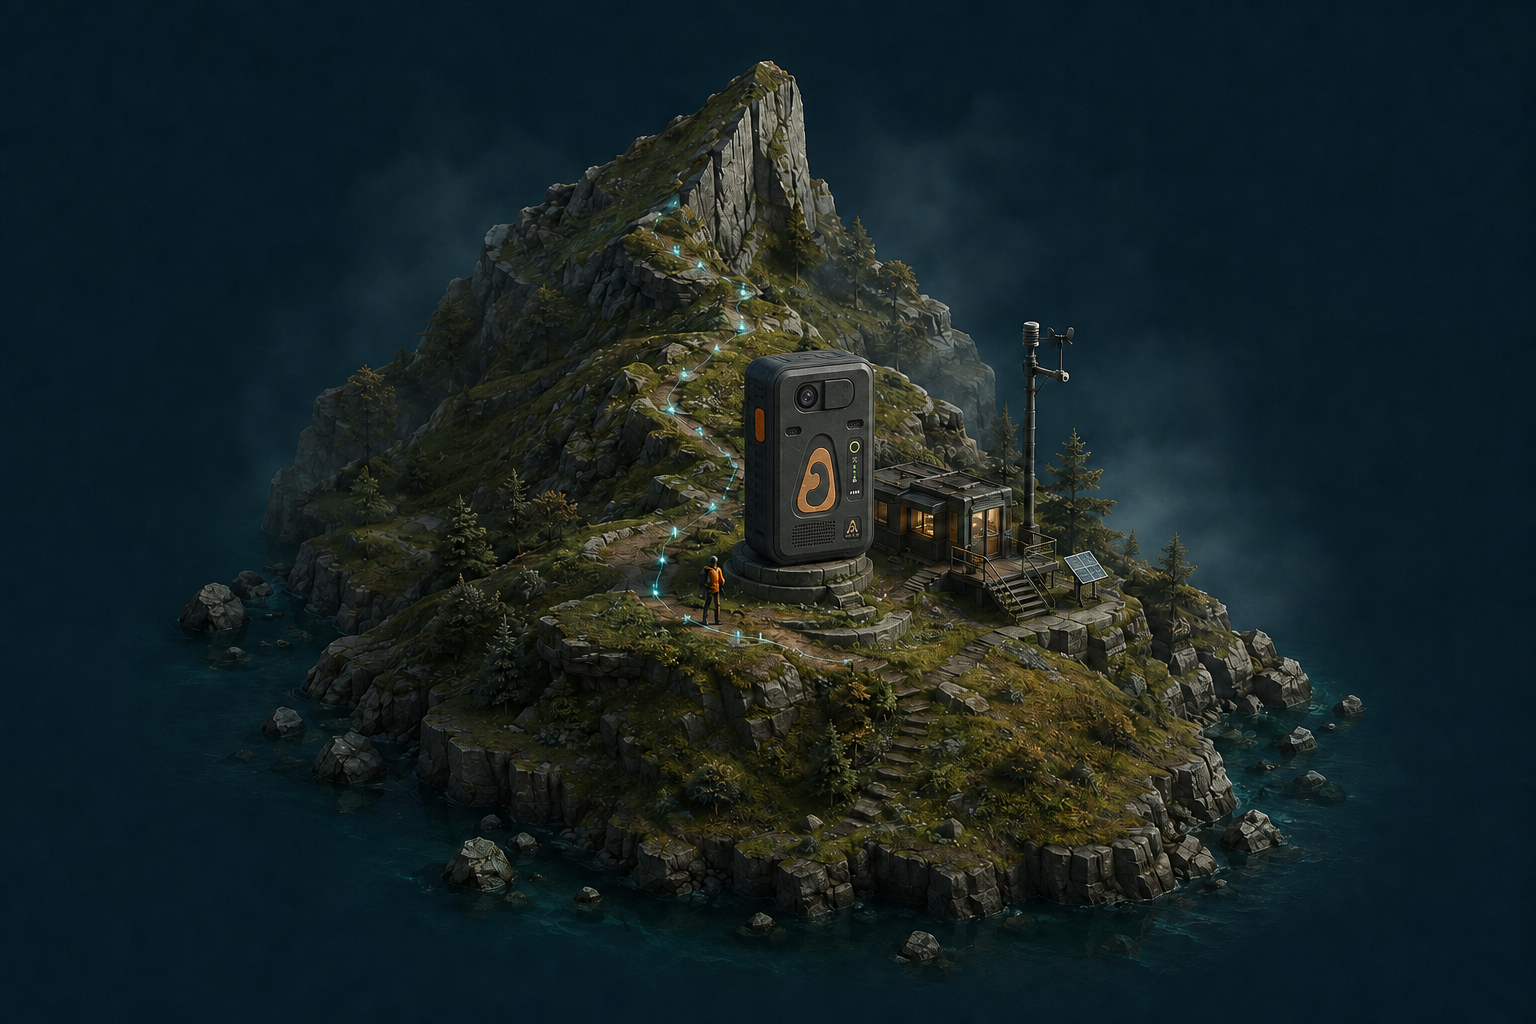
This box went into the mountains,
What do you hope it can help with?
First, let's hear your thoughts.
I will also talk today about why I wanted to make it.
Continue watching real stories, continue discussing projects.
 AHALabMMCOOL / Day Two
You can put it this way If you bring this box into the mountains, what help would you like it to provide? First, listen to two or three ideas, and return to discuss when talking about the workshop. Today, see how researchers handle real problems, hear stories from their youth, and then open the projects we are currently working on.
How to conduct onsite Only display the physical object and listen to a few words, do not arrange an identification test at the start. Write down students' questions on the whiteboard, and return to respond when talking about the Box.
Move to the next page Over two days, we have been focusing on four things, first let’s connect them.
01From the news back to life
 02
02Observing, researching, and taking action
 03
03Listen to them, also listen to you
 04
04Start from a need, learning while doing
See something, and also see who it relates to and how to continue exploring it.
AHALabMMCOOL / Day TwoYou can put it this way On the first day we looked at what is happening in the world. Today we continue to see how scientists and engineers work, listen to Boyan talk about problems from his youth. You can share your own ideas or temporarily have no answer. In the end, I will open the workshop and a few ongoing projects, talking about where problems come from, how to find information, and how to continue.
How to conduct onsite The four themes are a common thread for the two days, not four separate tasks. Using others and the world as material and course direction, students are not required to respond to each item individually.
Move to the next page Let's go back to the city yesterday that faced the flood.
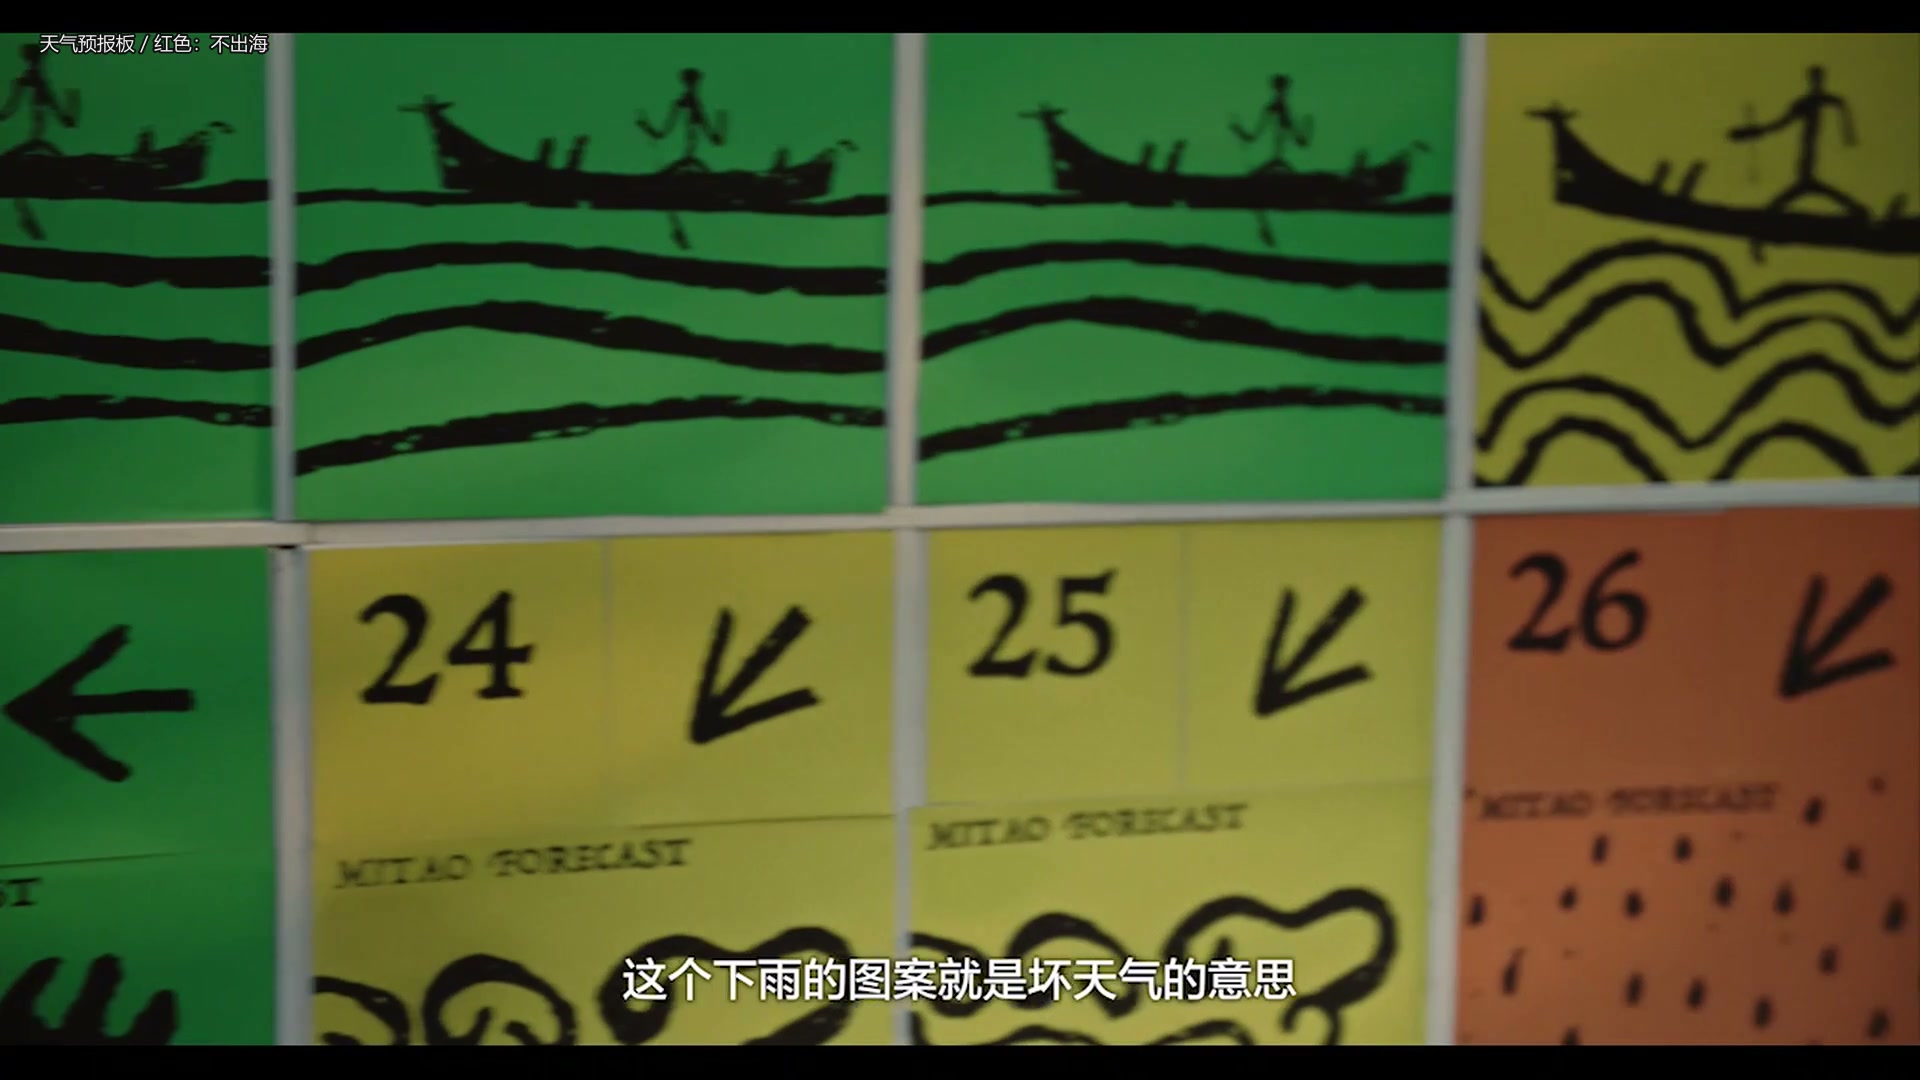
 From a town in the gameTo real-life forecasts
Each desk mate says one sentence
In this city, which step
is the hardest to decide?
If you could know one thing in advance,
what would you want to know?
First leave a question and see if today's story can answer it.
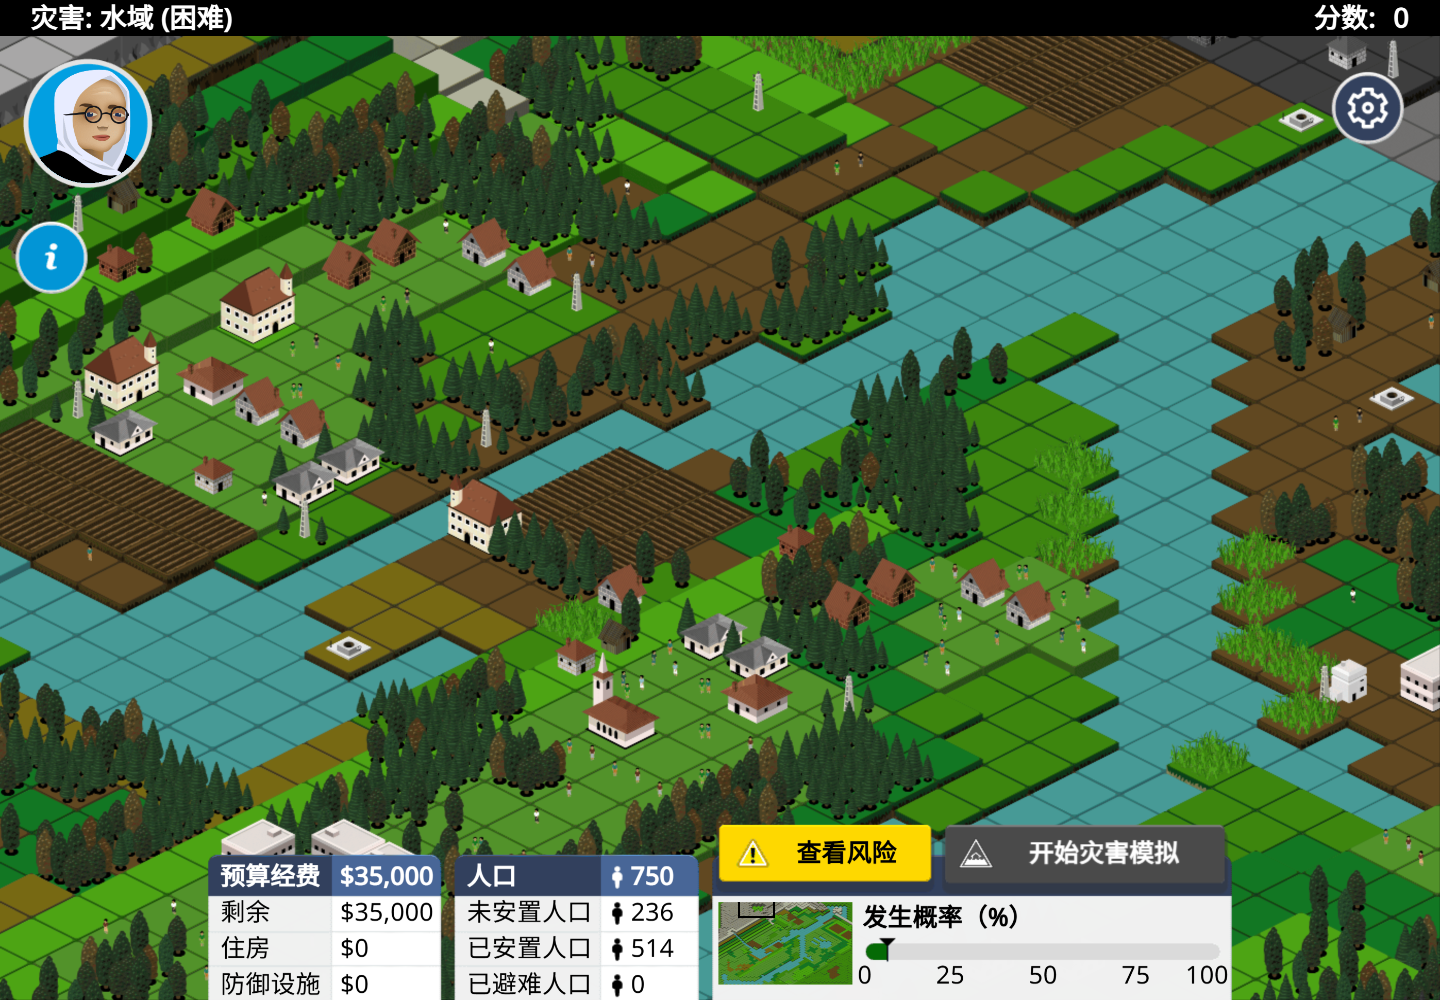
AHALabMMCOOL / Day TwoYou can put it this way Remember this map? The game lets people decide where to spend money and what to protect first. Even if you haven’t played, you can look at the map and imagine. Which step is the hardest to decide? Each desk mate says one sentence. If you could receive one piece of news in advance, what would you most want to know? Let's keep the question for now.
Image source Left image: Stop Disasters! Original flood scene screen capture. https://www.stopdisastersgame.org/game/?lang=zh_Hans
How to conduct onsite Each student voluntarily says one decision they find most difficult, then swipe from the game map to the fishing village forecast board. Keep for 2 minutes; no need to restart the game.
Move to the next page If we could know the weather in advance, the choices might be different. First, see how researchers bring information and solutions into real life.
Remember a method.
Who does it help?
AHALabMMCOOL / Day TwoYou can put it this way First, look at several real attempts: new ways of producing food, protecting migratory birds, predicting the weather. Pay attention to one method you want to learn more about, and who it is intended to help.
Watch and follow along In 8 minutes, spend about 6 minutes watching. Choose one segment each on food, ecology, and weather from the watch list, then leave 2 minutes for discussion. The public version keeps the original site link; if the internet is inconvenient, use images, principles, and teacher explanation to continue the discussion, without pretending you have already watched the video.
Watch entry film-library.html#science
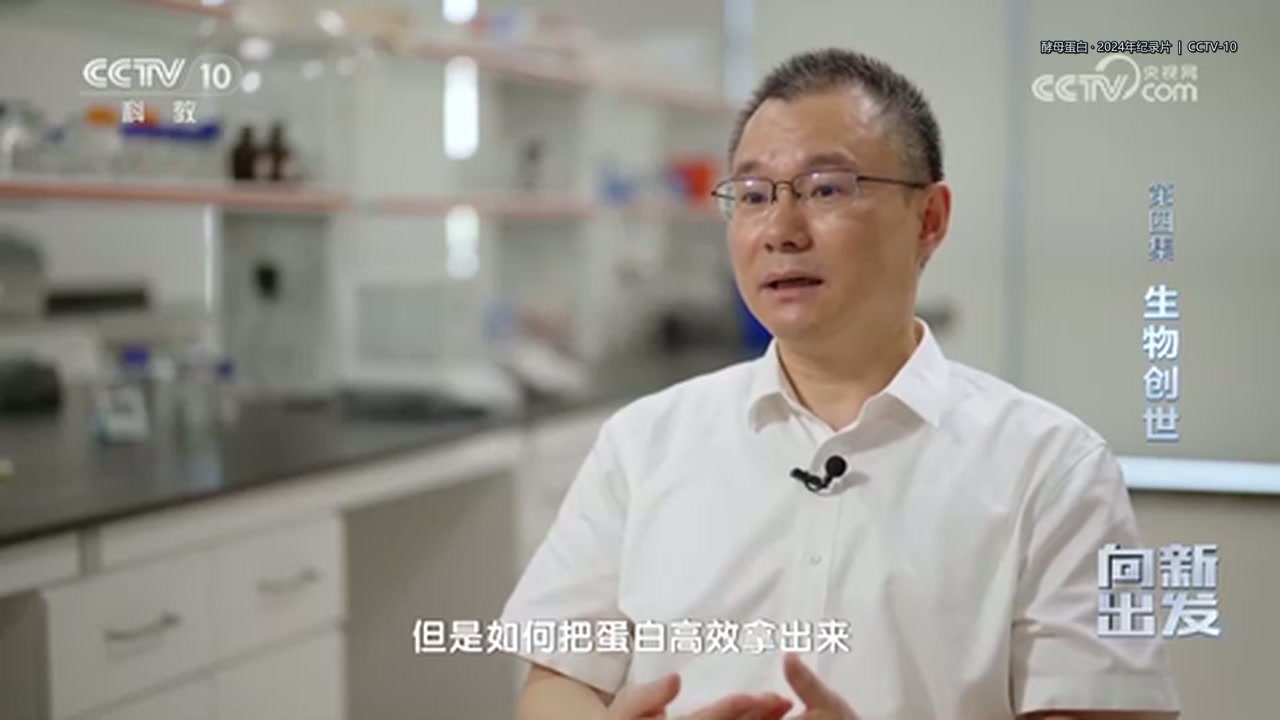
After making it, then check energy consumption, cost, safety, and scale.
AHALabMMCOOL / Day TwoYou can put it this way In the video, carbon dioxide synthesized into starch and yeast producing protein are two different routes. Both require raw materials, energy, and equipment. Can you point out what each requires? After the experiment is done, cost, scale, and food safety need to be examined further.
Source for reference (explain as needed) Chinese Academy of Sciences · Laboratory Synthesis from Carbon Dioxide to Starch (2021) | https://www.cas.cn/yw/202109/t20210924_4806812.shtml In 2021, the complete synthesis of starch from carbon dioxide was achieved; it requires raw materials, energy, and a catalytic system, and does not mean that food can automatically appear from air or that large-scale economic production has been realized. CCTV · Yeast Protein (2024) | https://tv.cctv.com/2024/12/26/VIDEgDO8WrxdrcuerEY3705p241226.shtml Yeast growth requires raw materials and conditions; food cannot be created out of nothing. DeepMind · AlphaFold | https://deepmind.google/science/alphafold/ Structure prediction provides research clues; functions and applications still require experiments.
DNA Science Animation · After-class Extension film-library.html#science
How to conduct onsite Ask students to identify one raw material or energy input without repeating playback. Distinguish between starch produced from carbon dioxide and yeast protein; do not present laboratory results as widely commercialized.
Move to the next page These new production routes need testing, just like weather forecasts need verification. Return to the several tools in the video.
Predict subsequent weather fields from the current atmospheric state.
Generate a set of possible weather scenarios.
Base model adapted to different tasks like weather.
Connect models, simulation, and visualization tools.
First ask about the task, time scale, and verification method, then compare performance.
AHALabMMCOOL / Day TwoYou can put it this way Pangu predicts weather fields, GenCast provides a set of possible scenarios, Aurora can adapt to different atmospheric tasks, and Earth-2 includes models, simulations, and visualization tools. When looking at them, first ask what is being predicted, how far in advance, and how it is validated. The demo code in class has not yet been run as real-time forecasts.
Source for reference (explain as needed) Pangu Weather · Author's open-source repository | https://github.com/198808xc/Pangu-Weather 2023 research case; actual performance is constrained by tasks, variables, and evaluation conditions. DeepMind · GenCast (2024) | https://deepmind.google/blog/gencast-predicts-weather-and-the-risks-of-extreme-conditions-with-sota-accuracy/ Describes weather uncertainty using ensemble scenarios; the probability chips in class are a fictional demo. Microsoft Research · Aurora (2025 introduction) | https://news.microsoft.com/source/features/ai/microsofts-aurora-ai-foundation-model-goes-beyond-weather-forecasting/ Can adapt to different Earth system prediction tasks, but does not claim comprehensive superiority based on promotional images. NVIDIA · Earth-2 | https://www.nvidia.com/en-us/high-performance-computing/earth-2/ A system of models, tools, and simulation platforms, not a single model that can decide the future.
Pangu unofficial demo code https://github.com/HaxyMoly/Pangu-Weather-ReadyToGo
How to conduct onsite About 2 minutes on this page: ~1 minute to identify the different tasks of the four tools, 1 minute to listen to an interesting direction and transition. The issue of model validation is addressed in detail on the next page, no ranking comparison is made.
Move to the next page These models need to be developed by researchers. Currently, there are also teams involving AI in developing weather models. Once developed, what still needs to be confirmed?
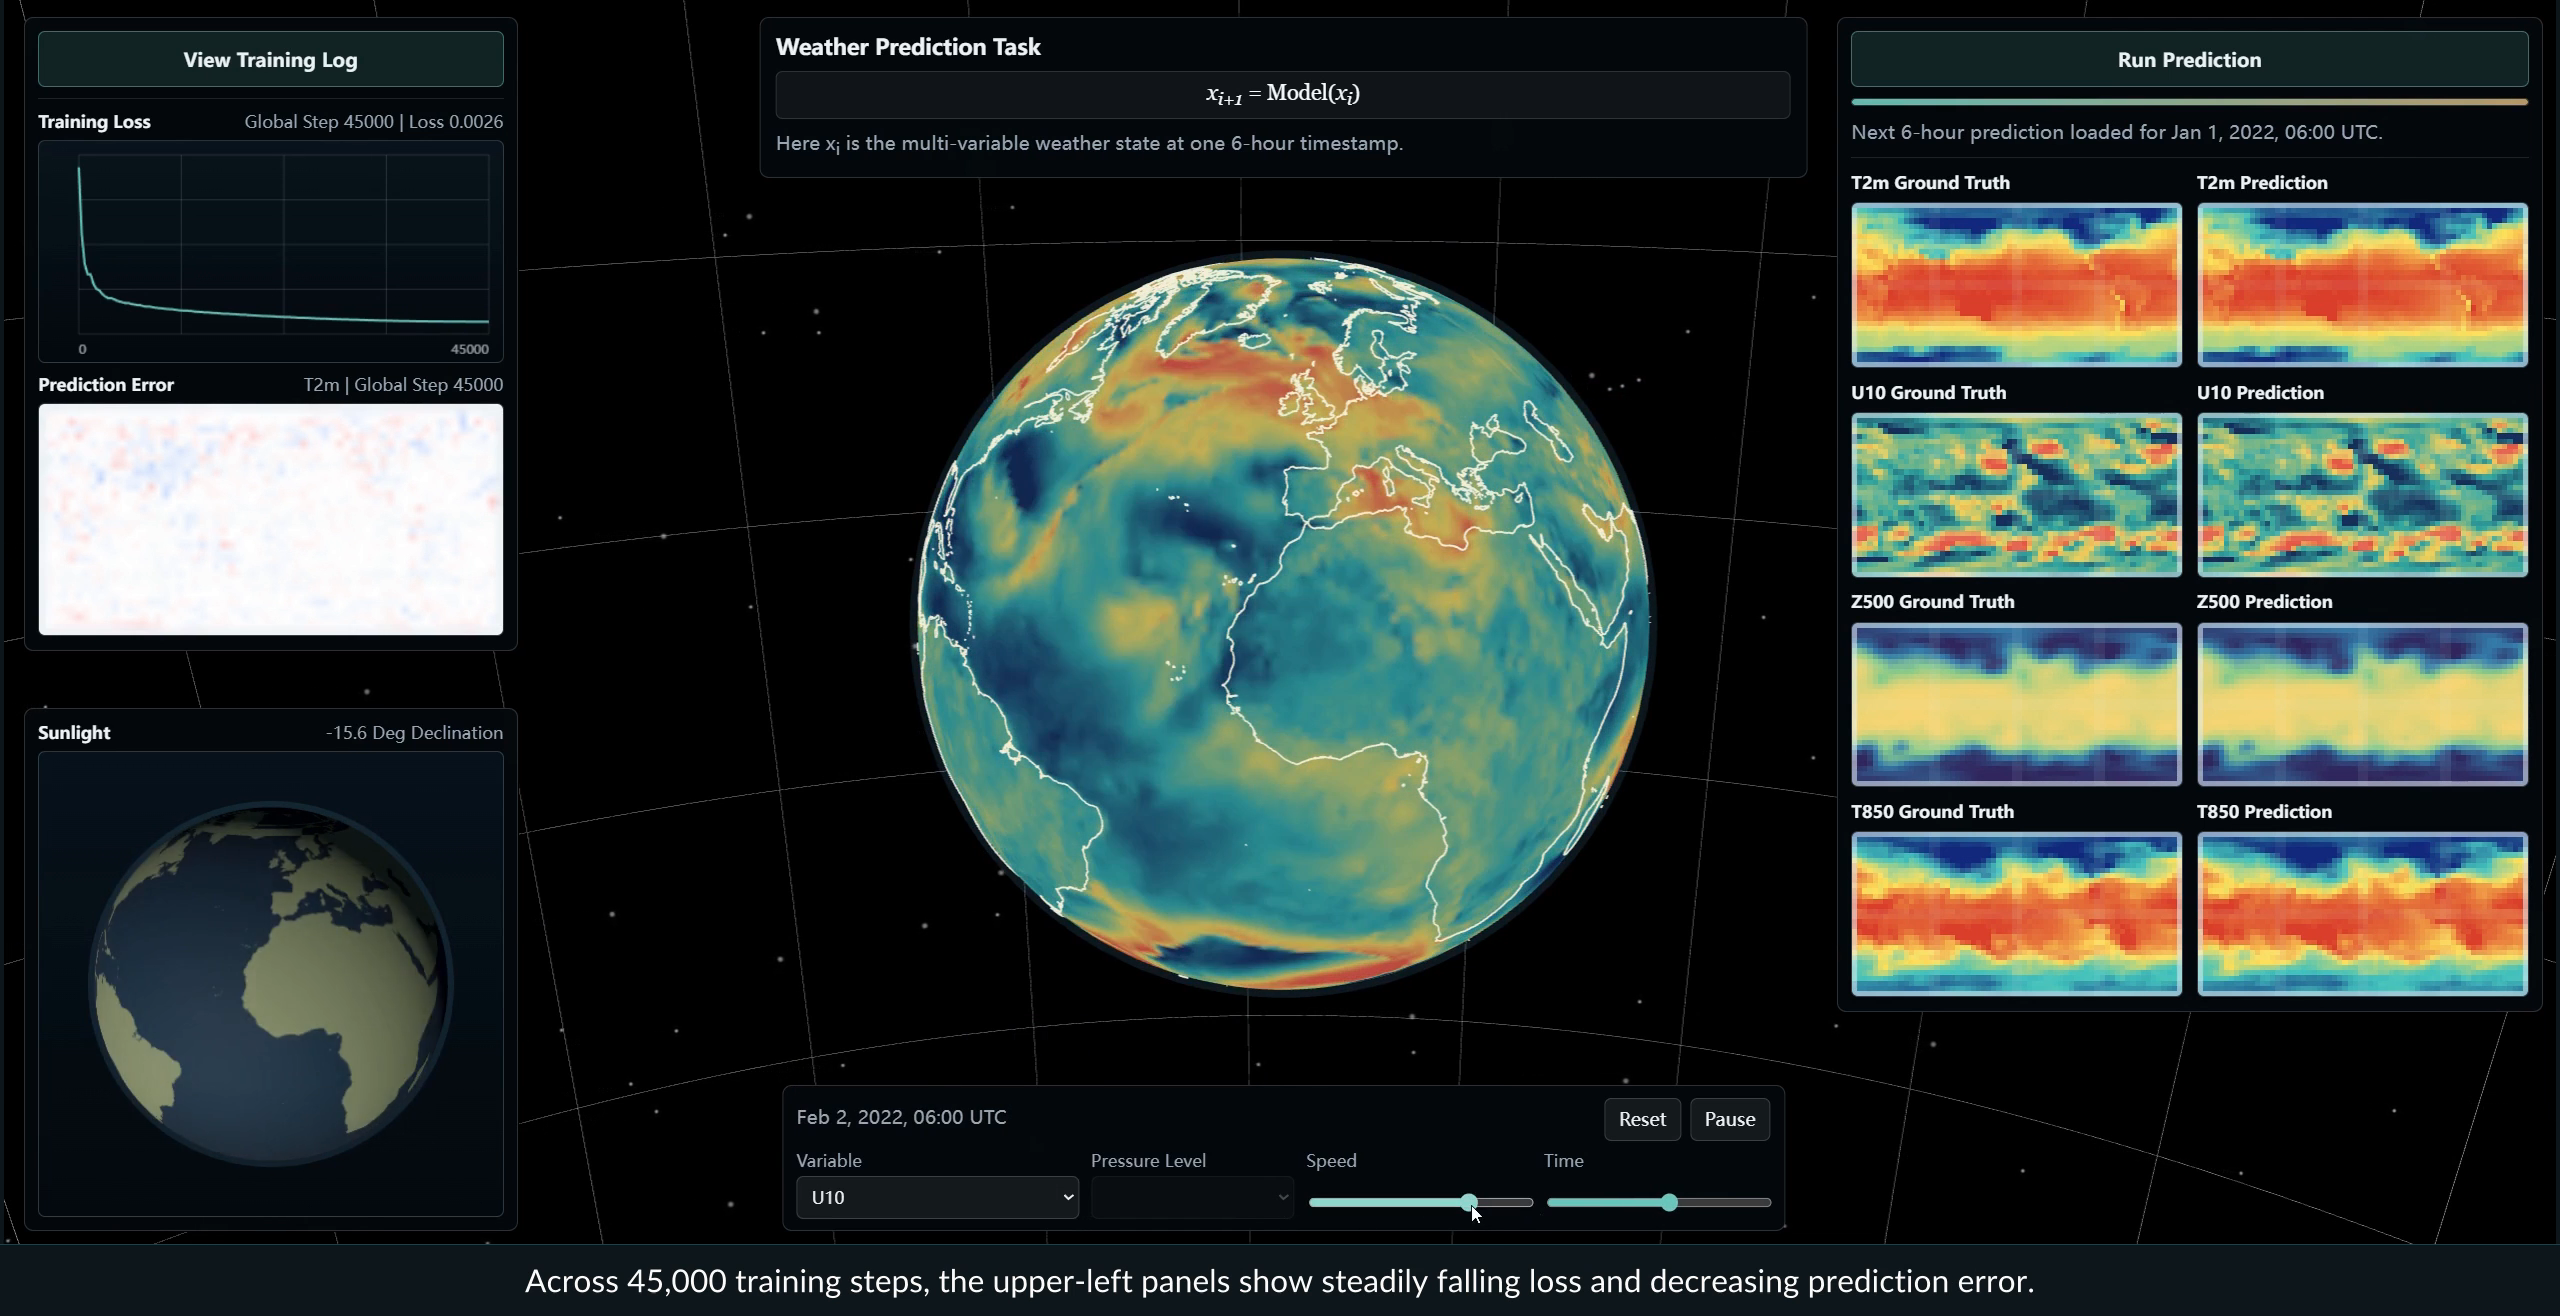
Verify the source, time, and coverage area.
Reserve data not used in training or tuning to check errors.
Arranging travel or issuing warnings requires different types of evidence.
If you’re going into the mountains this weekend, what else would you want to confirm?
Original report and verification instructions ↗AHALabMMCOOL / Day TwoYou can put it this way We just looked at several weather forecasting tools. The Atria team also demonstrated another thing: involving AI in processing meteorological data, implementing a model, and running training. The screen shows the demo interface provided in their report. If we want to go into the mountains this weekend, can we base our route directly on this image? What else would you want to confirm? After creating it, you need to check the data sources, use data that wasn’t involved in training or tuning to verify errors, and see if it meets the specific purpose. Demonstrations of global weather models also can’t be taken as proof that a particular mountain route is safe. When humans and AI research together, the requirements proposed by humans, the chosen verification methods, and the judgment of results are all very important.
How to conduct onsite This page 2 minutes: About 45 seconds to demonstrate what was done, 40 seconds to listen to one or two students' points for confirmation, 25 seconds to supplement data and independent verification, 10 seconds to connect to AI Quest. The three questions are discussion cues; there is no requirement to answer with technical terms; if necessary, illustrate with “evaluate yourself with practiced questions versus doing a set of unseen questions, what is the difference.” This page does not include live models or forecasts, nor does it additionally play long videos. Original video and AI Quest time are preserved.
Confirmable author report Original report pages 4–5: In the demonstration with network search disabled, processing over 100GB of meteorological data, implementing a ViT-like network with over 400 million parameters, training 45,000 steps, involving 69 meteorological variables. This is a curated example from the author’s report, not an independent reproduction for this course; it does not represent the average task success rate. Figure 2 on page 5 notes that the weather interface does not report forecast accuracy. https://github.com/atria-asi/Atria-Dawn-Preview/blob/main/atria-dawn-preview.pdf
Scope of scientific verification “Hold out unseen data, compare with references, check errors and usage” is the verification requirement proposed in this course; it does not claim that Atria's weather model has been verified according to this method. Reference data must also indicate source and quality, the Ground Truth in the interface cannot be treated as error-free observation. Avoid overlap of training, tuning, and final test data; for time series, be cautious of temporal leakage, separate check by forecast horizon, variable, and region, and compare with appropriate baselines under the same setting. Also check usage scenarios such as extreme events. The above content is for teachers to expand through questioning, not to force-feed terminology in 2 minutes.
Unsupported conclusions on this page The article mentions 'predicting the next week in one minute' and that some metrics surpass FourCastNet, but the corresponding sections in the report do not provide sufficient time configuration or comparison results to verify these claims, so they should not be used as a conclusion about classroom performance. One minute should not be treated as the design training time for the entire model. Pages 7–8 and 12–13 of the report still list sustainable recursive self-improvement as an open question, and it cannot be stated as already achieved. The human-machine division recorded in the research tasks is a case from that team and cannot prove that human judgment is necessarily correct or that all studies follow the same approach.
Image, Time, and Original Source This lesson is based on the local report snapshot, accessed and verified on September 15, 2026.
Move to the next page Next, it's our turn to make a choice: predicting floods, what data should we give to the AI? Open AI Quest and take a look.
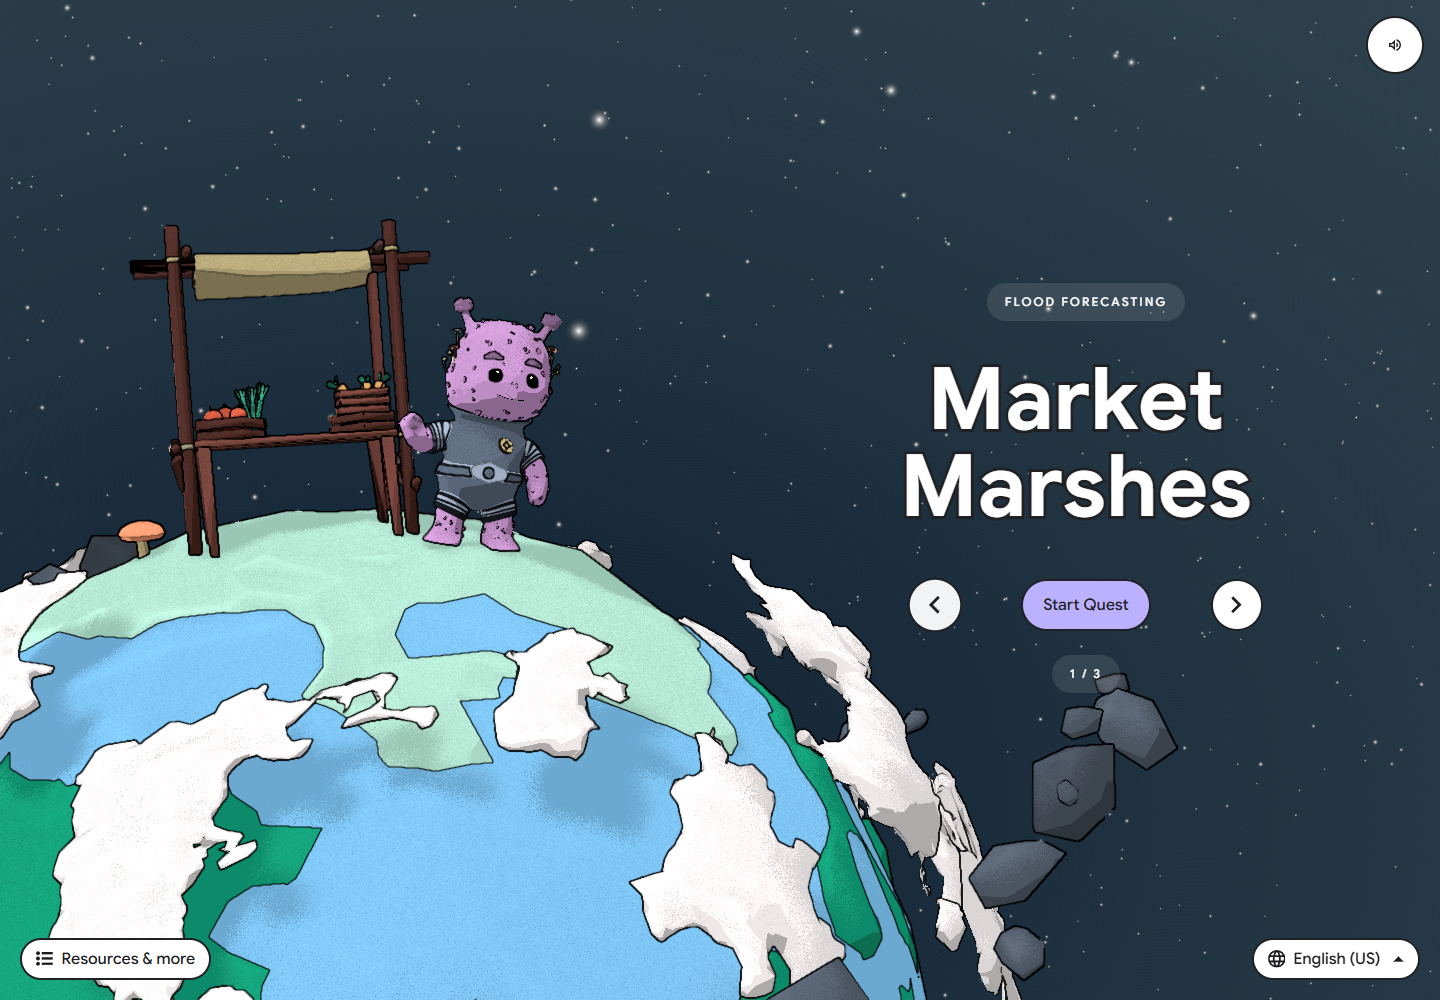
Before the warning is issued,
First pass the data stage.
Which materials to choose?
How can we know if the model has really learned?
What should be done after receiving a warning? Today: Why is this warning trustworthy?
AHALabMMCOOL / Day TwoYou can put it this way This task is called Market Marshes, from Google Research and the Stanford Learning Accelerator. Let's help a market that will be affected by floods. Don't rush to click on training yet. If you want to know whether the river will rise, what information should you look for? How is the information you choose related to this question?
Chinese guide play and original version entry ./ai-quests.html#classroom
Google AI Quests https://research.google/ai-quests/intl/en_us
Development and Classroom Materials https://research.google/ai-quests/intl/en_us/teacher-resources https://research.google/ai-quests/intl/en_us/additional-resources/flexible-quest-market-marshes https://research.google/ai-quests/intl/en_us/faq Developed by Google Research and the Stanford Accelerator for Learning. The official website has full offline projection support; this 5-minute segment activity is designed by AHALab, and the teaching effectiveness of this segment activity needs to be observed in practice.
How to conduct onsite Four people can pair up in twos, scan the QR code to open the original Google AI Quests, or gather around the same screen. In 5 minutes, only do one set of data or prediction choices and discuss the reasons, without committing to completing the entire game; when the network is unavailable, use the local instruction page to discuss the same issues.
Move to the next page The model calculates results, but someone still needs to understand them, receive them, and be able to take action.
AHALabMMCOOL / Day TwoYou can put it this way Just now we selected data and discussed how to validate the model. Now assume the forecast has passed validation. Will one reminder necessarily help people? Some do not have phones, some cannot see the text clearly, and some receive the alert but have no transportation. Following the steps of receiving, understanding, verifying, preparing, and confirming completion, find a place where human assistance is still needed.
How to conduct onsite 1 minute: 30 seconds to connect AI Quest with the user's scenario, 20 seconds listening to a part that may not connect, 10 seconds to shift to ecological observation. Do not mention previous versions of birdwatching trips.
Move to the next page Start by reminding people to prepare for weather risks, then see how tools can help observe other life forms.
False Positive 8 Missed Detection 6
Fictitious exercise, not project accuracy
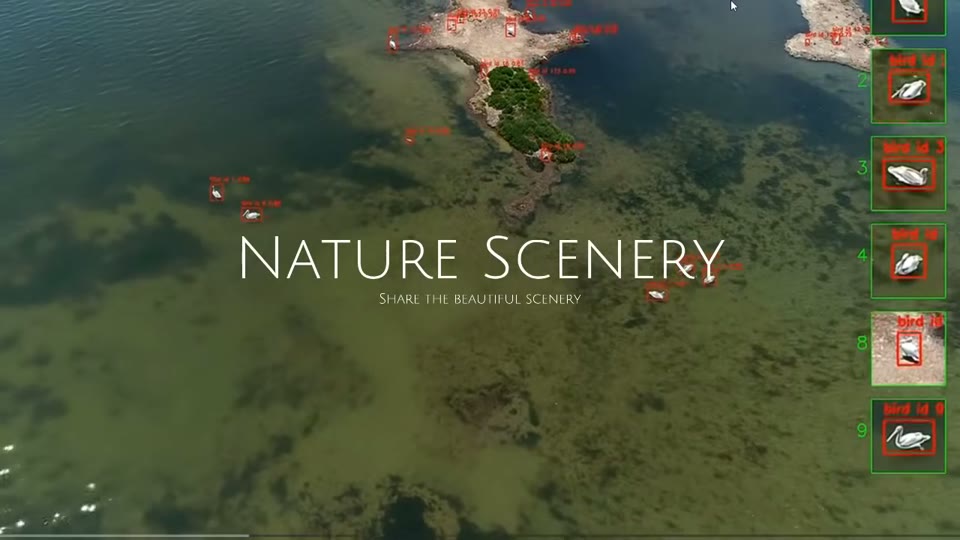
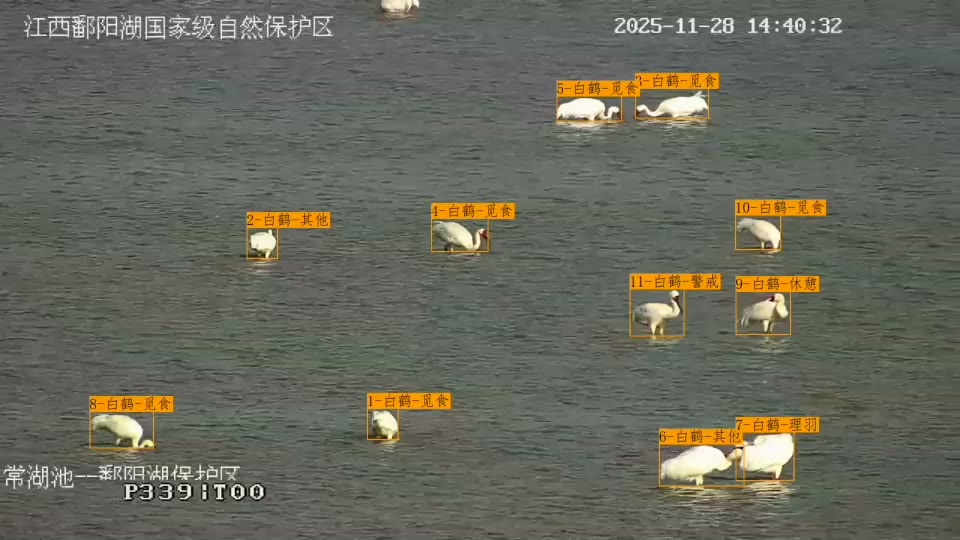
AHALabMMCOOL / Day TwoYou can put it this way This is footage from the AVIS project bird detection; you can open the clip from the original site. Did the frame follow consistently? Which scenes do you want to pause and watch again? The 100 images next to it are another set of fictitious exercise data, 50 of which contain birds. Increasing the threshold reduces false positives but may increase missed detections. Which type of error worries you more, and why?
Original footage of bird detection demonstration https://www.zimablueai.com/project-avis.html
Four monitoring videos included in AVIS ./avis-videos.html
Local source verification in AVIS Original site: https://www.zimablueai.com/project-avis.html
How to conduct onsite Play the existing bird detection screen recording, then have a student describe the clues they see. The threshold animation is illustrative and does not reflect the real model parameters used in this video.
Move to the next page After retaining the footage, someone still needs to go to the site.
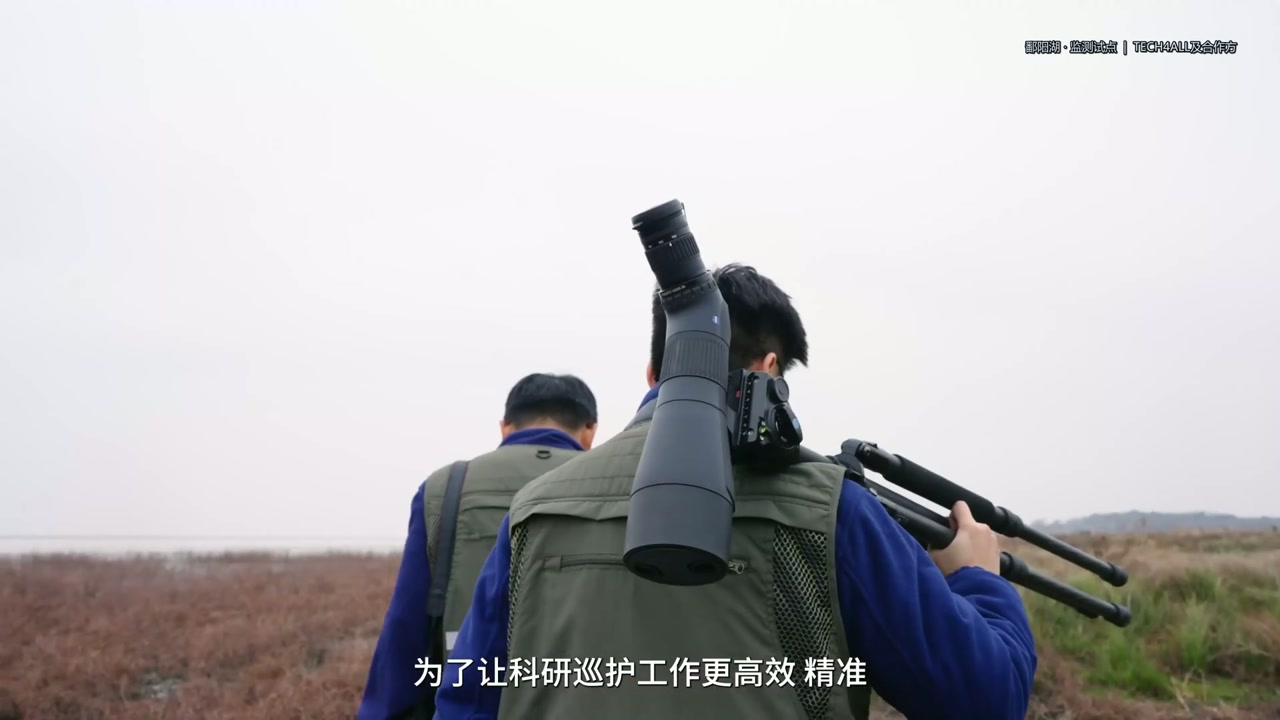
Monitor and patrol in coordination; exact locations also need protection.
Recording and identifying maternal and juvenile behaviors in breeding protection.
Radar monitoring of migration, serving plant protection assessment.
If we start from one square kilometer around us, which birds can we recognize?
AHALabMMCOOL / Day TwoYou can put it this way Monitoring at Poyang Lake needs to coordinate with patrols. In Yangtze River porpoise research, some record and identify maternal and juvenile behaviors during breeding. Migratory insect radar helps assess pest situations. Each serves a different task; just because devices are used does not mean technology has solved conservation problems.
Source for reference (explain as needed) Huawei and Partners · White Cranes of Poyang Lake | https://www.huawei.com/cn/tech4all/stories/protecting-white-cranes-ai-poyang-lake Description of institutional projects; monitoring capabilities and final outcomes of ecological protection are checked separately. Institute of Hydrobiology, Chinese Academy of Sciences · Yangtze Finless Porpoise Behavior Recognition (2026-06-23) | https://www.ihb.cas.cn/xwdt/zhxw/202606/t20260623_8232072.html Intelligent behavior recognition for breeding and conservation sites, cannot be generalized to cover the entire Yangtze River in the wild. Xianghu Laboratory · Zhejiang Insect Radar (2025-06-13) | https://www.xhlab.ac.cn/xhdt/xhyw/202506/t20250613_956.html Provincial migratory pest monitoring and early warning trial operation; do not state unverified largest in the world. Huawei · TECH4ALL | https://www.huawei.com/cn/tech4all Project entry for company cooperation with conservation and research institutions; follow up on actual tested results and maintenance.
How to conduct onsite Ask students to observe a patrol task: what people need to confirm, and which steps tools can save.
Move to the next page When protecting habitats, we also encounter issues about energy and land use. You have left records of this while traveling the Hexi Corridor.
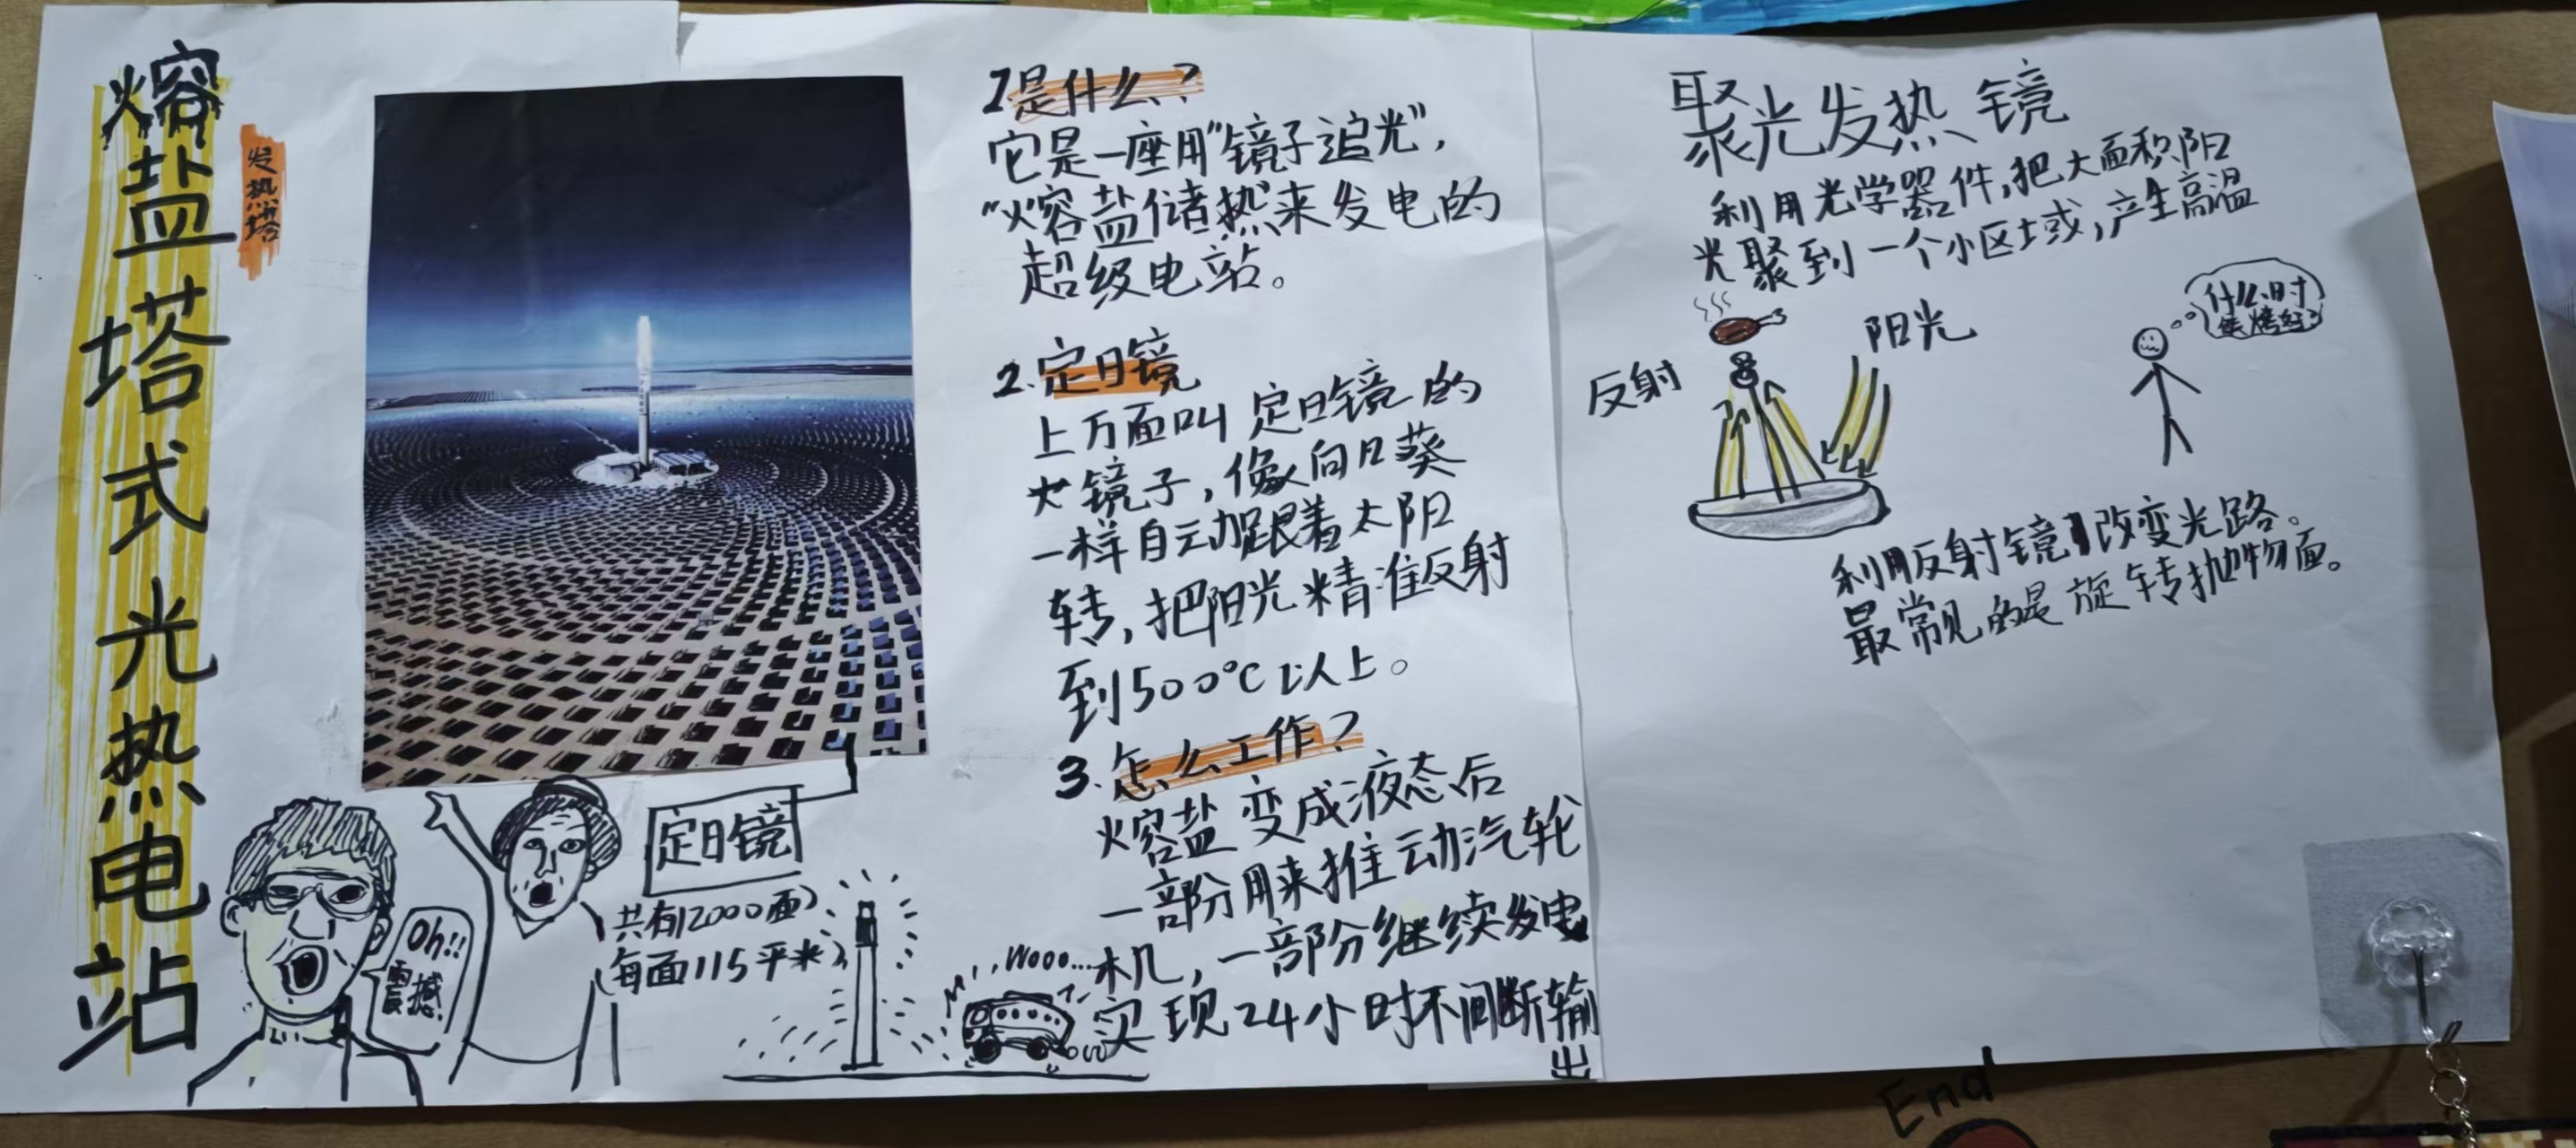
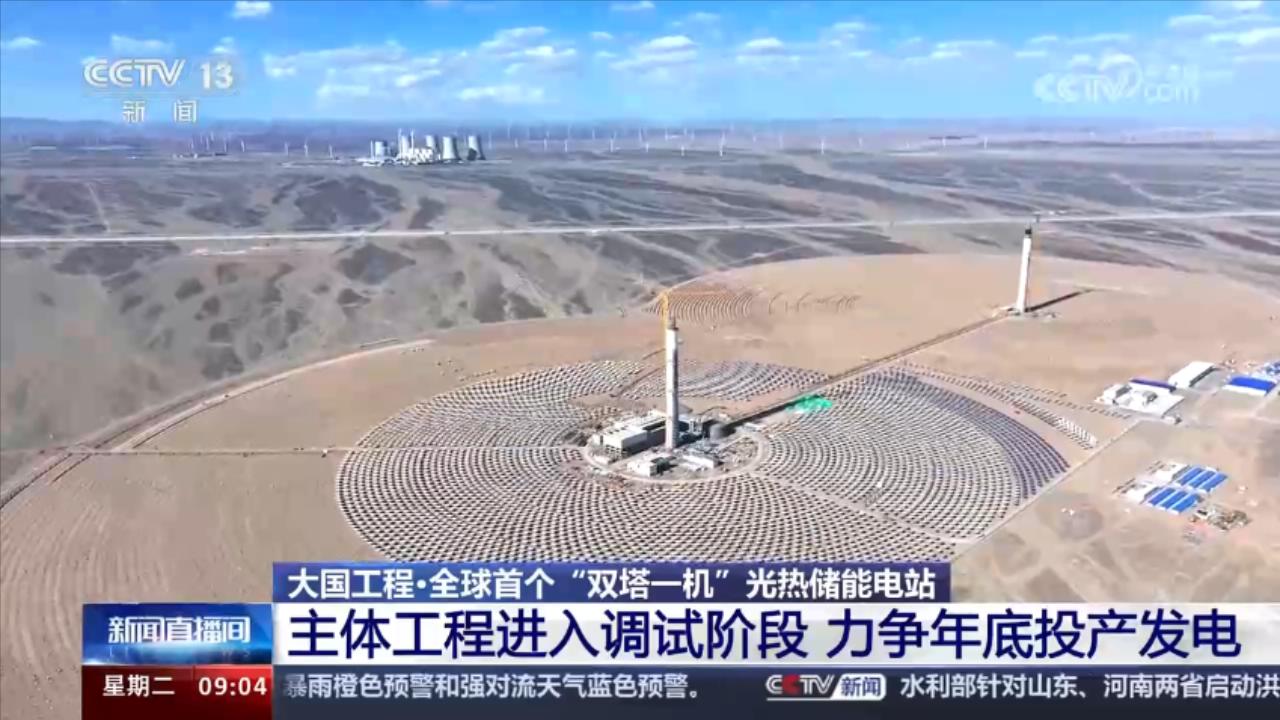
Heliostats, rotating to track the sun
Dual mirror field concentrating heat, sharing a turbine generator
Reported thermal storage duration in the design
Mirrors focus the light, molten salt stores the heat. At which step is electricity generated?
AHALabMMCOOL / Day TwoFind the equipment from the hand-drawn sketch First, look at the students’ notes. Does anyone remember why the mirrors on site rotate? They are called heliostats, which track the sun and reflect light to the top of a heat absorber tower. On the right is a similar project — the twin-tower power station in Guazhou, Gansu: nearly 30,000 mirrors, two towers, sharing one steam turbine generator. It has a molten salt storage system designed for six hours. The mirrors themselves do not convert light directly into electricity; before real generation, the heat must undergo several processes.
Sources and numerical range CCTV, 2024-07-16, Guazhou Twin-Tower Concentrated Solar Thermal Storage Power Plant: https://news.cctv.cn/2024/07/16/ARTIu4jiTlB5HCrY2aMNyJVv240716.shtml Nearly 30,000 heliostats, two towers one turbine, 6-hour thermal storage all come from the reports and statements by the project leader at the time. The report's statement “molten salt boiling point 600°C” is not used; melting point, working temperature, thermal stability upper limit are different from boiling point and cannot be confused. DOE principle explanation: https://www.energy.gov/cmei/systems/thermal-storage-system-concentrating-solar-thermal-power-basics
How to conduct onsite First, look at the students’ hand-drawn Hexi Corridor map; if anyone participated, listen to their additions. Click on existing Guazhou power station news to see the site, play takes 3 minutes on this page, no extra time added. The power station investigated by students is not mixed with the similar project on the right.
Move to the next page Follow the heat cycle, and you can understand how electricity continues to be generated after sunset.
How long it can generate power depends on how much heat is stored, the required power output, and subtracting heat losses.
Collect heat during the day; generate power at night using stored heat; when there is no new heat source and the stored heat is exhausted, power generation cannot continue.
AHALabMMCOOL / Day TwoExplained along the two loops Mirrors concentrate light at the top of the tower, heating molten salt that flows through the heat absorber. The hot salt is stored in an insulated tank. When power is needed, the heat is transferred to the steam generator. Water turns into steam, drives the turbine, which then drives the generator. The released hot salt returns to the cold salt tank, waiting to be reheated; it is called cold salt here, but it is just a relatively lower temperature—it is still very hot and must remain liquid. The steam condenses into water, flows through its own loop, and does not mix with the salt.
Daytime, nighttime, and depletion Switch the button to night: the mirror field no longer collects sunlight, but the thermal salt tank can still provide heat. Then switch to storage depletion: if there is no new heat source, power generation cannot continue. It functions like a large heat-insulating storage system and also has heat loss. Six hours is the design specification of a specific project and should not be understood as unlimited endurance under any weather or any electricity consumption.
Principle Source DOE: Double-tank direct thermal storage loop, thermal salt produces steam via a heat exchanger, and after cooling returns to the low-temperature tank. https://www.energy.gov/cmei/systems/thermal-storage-system-concentrating-solar-thermal-power-basics DOE: Existing solar thermal power plants commonly use liquid nitrate salts for heat storage and transfer. https://www.energy.gov/cmei/systems/solar-thermal-energy-storage-and-heat-transfer-media Classroom illustrations and three operating conditions are arranged by AHALab, not the actual control system or measurement data of any power plant.
How to conduct onsite Use the original heat flow diagram to identify concentrating, storage, steam, and power generation; do not refer to heliostats as photovoltaic panels.
Move to the next page The mirror field can provide electricity, but it also occupies land and changes surrounding conditions. What about the life that originally lived here?
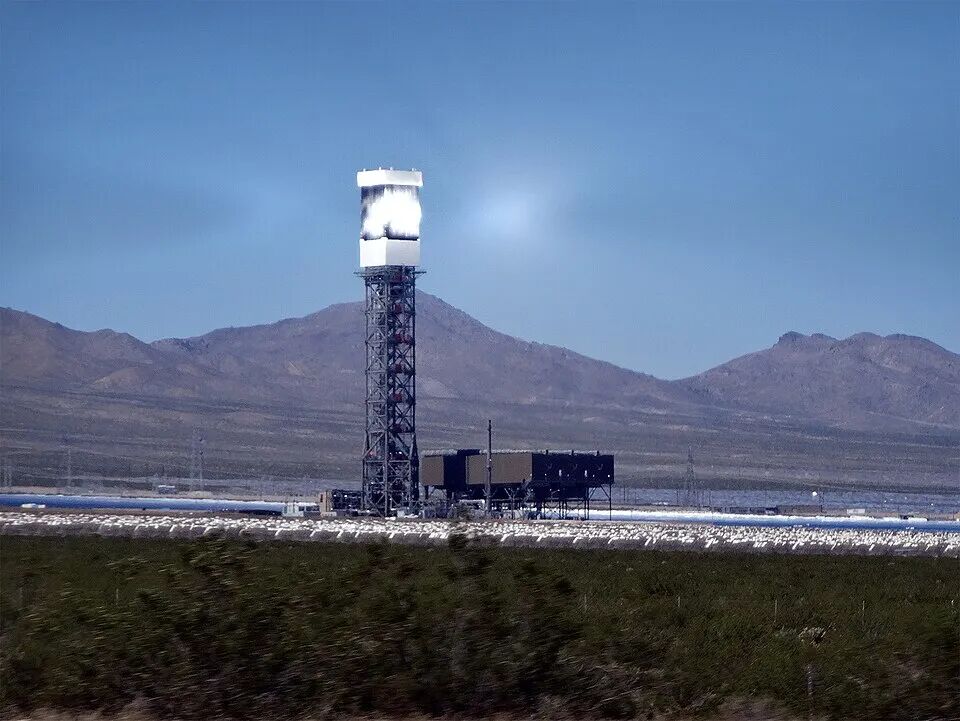
Both high light flux damage and collision need to be examined.
Mirror fields, roads, and fences will change habitats and pathways.
Different cooling methods require different water pressures.
Thermal storage solves the problem of power generation periods; birds, habitats, and water also need to be protected separately.
Looking back at Guazhou: even with molten salt thermal storage, ecological assessment is still necessary.Real cases, mitigation measures, and complete comparisons ↗
AHALabMMCOOL / Day TwoReturning from the principle of power generation to the site Earlier we looked at how heat is stored. Now let’s look around the power station: the birds in the sky, the animals and plants on the ground, also live here. Ivanpah has a very large mirror field; the high flux around the top of the tower can harm flying birds, and facility collisions also require investigation. Roads, fences, and construction will alter animal habitats and pathways. The desert is not just an empty space waiting to be used.
Distinguish technologies while also looking at common problems Ivanpah generates steam directly with concentrated sunlight and does not have molten salt thermal storage. The Guazhou power station we looked at has a thermal storage system, which allows the stored heat to be used at night. But thermal storage does not automatically remove the impacts of concentration, land use, and water usage. To judge whether ecology has improved, it is not enough to look at how much greenery there is; you must observe the changes in species that originally lived there, pathways, local plants, and water.
How to conduct onsite Use existing real photos to observe the mirror field and surrounding ecology; retain the identity of data from different locations. Do not directly treat the green grass under mirrors as evidence of overall ecological improvement.
Move to the next page The previous molten salt was used to store solar heat. Another technology also called molten salt has heat that comes from nuclear reactions; distinguish the two first.
The previous solar-thermal heat comes from the sun; the heat here comes from nuclear fission.
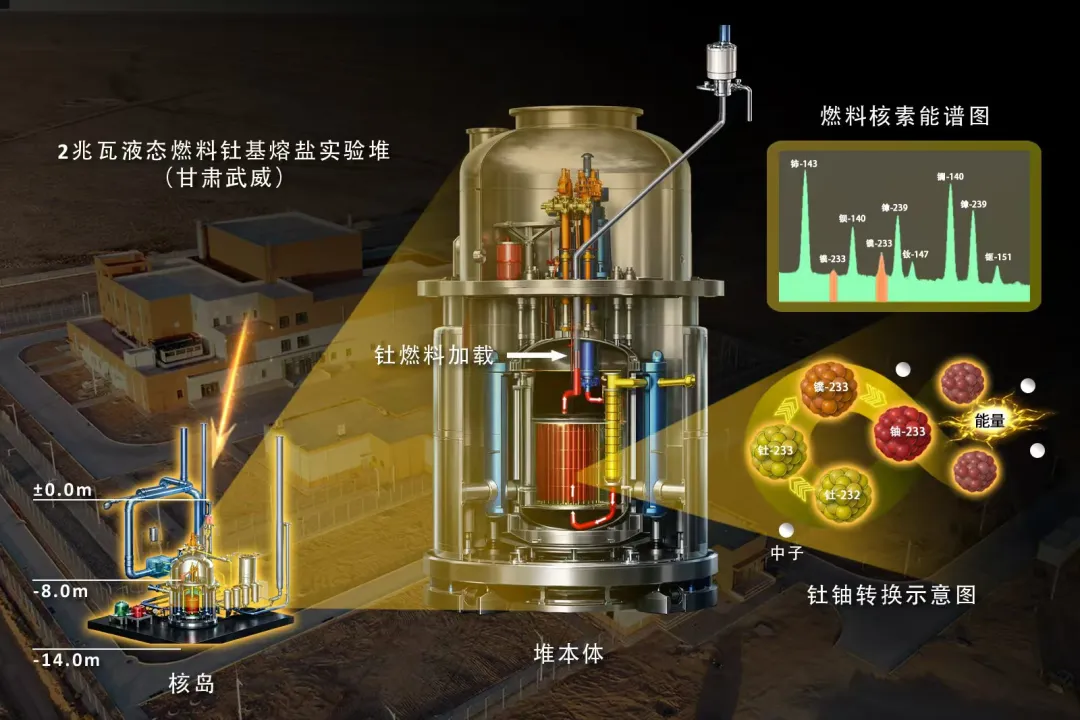
The "Project 728" researched molten salt reactors, later shifting to pressurized water reactors.
The Chinese Academy of Sciences launched a special thorium-based molten salt reactor project.
Obtaining direct evidence of key nuclide changes.
In March 2026, it was selected as one of the "Top Ten Scientific Progresses in China" for 2025.Next step, how to make it operate long-term and reliably?
AHALabMMCOOL / Day TwoYou can put it this way The salt just now was heated by sunlight. The salt in this picture contains nuclear fuel, and the heat comes from nuclear fission. When reading the research introduction from the Shanghai Institute of Applied Physics, I noticed that this path has already been pursued in China for more than half a century. In the 1970s, the “Project 728” explored molten salt reactors, but later adjusted its direction; in 2011, the Chinese Academy of Sciences restarted this research. By 2025, researchers reported that in the experimental reactor in Wuwei, Gansu, the conversion from thorium to uranium had been verified. It can be understood like this: thorium undergoes nuclear transmutation to form fissionable uranium-233, which releases energy through fission. This experiment measured changes in key nuclides, providing direct evidence. The achievement was selected as one of the “Top 10 Scientific Advances in China in 2025” in March 2026. Next, the goal is to turn this capability into long-term, reliable engineering: will salt corrode pipes at high temperatures? After the reactor is shut down, where does the heat go? These also need to be addressed one by one.
History and Experimental Progress The 1970s narrative is used for introduction; details were cross-checked with Shanghai Institute of Applied Physics researchers: https://www.sinap.cas.cn/xwzx/cmsm/202511/t20251101_8004733.html 2011 special restart: https://www.sinap.cas.cn/zt/jnxhjlsz/mtbd/202511/t20251105_8006500.html 2025 experimental report: https://www.sinap.cas.cn/xwzx/kydt/202511/t20251102_8004865.html List of selections announced by the National Natural Science Foundation on 2026-03-25: https://www.nsfc.gov.cn/p1/3381/2821/121279.html We do not replace evidence with classmates’ forwarding relationships, nor equate awards with commercial reactor safety certification.
Complete Illustrations, Real Scenes, and Materials ./nuclear-reference.html#china-progress
How to conduct onsite Explain the research progress and experimental reactor scale in two minutes. Existing material sources remain on the reference page, without committing the experimental results to commercial reactor performance.
Move to the next page Understand what step it has achieved, and then compare where it has design advantages in accident mechanisms.
Whether it can withstand power outage accidents more safely also depends on residual heat cooling, barriers, and engineering verification.
| Safety Issues | Fukushima accident unit · BWR | Liquid fuel thorium-based molten salt reactor · design route |
|---|---|---|
| Pressure | In-reactor water about 7 MPa Water loss, depressurization, and replenishment all need to be addressed | Fuel salt loop can approach atmospheric pressure Reduce the driving force for leakage caused by pressure |
| Reactor shutdown | After stopping the chain reaction, there is still residual heat Cooling continued to fail in the Fukushima accident | Residual heat still needs to be continuously removed Some designs use natural circulation and salt drainage cooling |
| Barriers | Fuel cladding, pressure boundary, containment Extreme accidents can damage multiple barriers | Salt loop, collection and containment facilities Corrosion, leakage, and heat removal capabilities still need verification |
Shutdown after earthquake → Tsunami destroys power supply and cooling → Residual heat damages fuel → Hydrogen generation and release of radioactive materials
Probability of a full plant accident: current data are insufficient for ranking on the same scale.Complete references and sources ↗
AHALabMMCOOL / Day TwoYou can put it this way If you ask which is safer, I can first give a judgment within a range: to prevent high pressure from pushing out radioactive materials, liquid-fuel molten salt reactors have a design advantage. The water in boiling water reactors like Fukushima operates under high pressure, whereas the fuel salt loop can be near atmospheric pressure. Then, you might ask, are they still safe if the power is out? Both types of reactors have residual heat after shutdown, which must continue to be dissipated. Some molten salt reactor designs use natural circulation, or transfer the fuel salt to containers with cooling capacity. They have the potential to change the course of an accident, but the cooling's sustainability and container reliability still need verification. We cannot determine that a future plant's accident probability is necessarily lower based solely on "low pressure."
Factual basis and applicable scope S1 · IAEA · Status of Molten Salt Reactor Technology (2023) https://www-pub.iaea.org/MTCD/Publications/PDF/STI-DOC-010-489_web.pdf Chapter 3: Potential advantages of low pressure and radioactive material retention, as well as R&D challenges in salt chemistry, materials, and safety analysis; PDF pages 24–33. S2 · IAEA · The Fukushima Daiichi Accident (2015) https://www-pub.iaea.org/MTCD/Publications/PDF/Pub1710-ReportByTheDG-Web.pdf Accident units, BWR principles, loss of cooling after shutdown, radioactive release, and recovery work. BWR about 7 MPa, see Box 2.1, PDF page 38. S6 · IAEA · Molten Salt Reactor Materials R&D Workshop (2026) https://conferences.iaea.org/event/466/ 2026 research agenda on materials, corrosion, salt chemistry, and multiphysics analysis. Used to illustrate engineering issues that still need verification; the conference agenda is not considered a safety performance validation.
Complete comparison table and materials ./nuclear-reference.html
How to conduct onsite Maintain the existing comparison perspective: design advantages in high-pressure release mechanisms do not mean all accident risks are lower. Detailed evidence can be seen in the original reference pages.
Move to the next page Pressure conditions are one aspect; whether radioactive materials can be retained also depends on which links.
This is an advantage along partial contamination pathways; the overall contamination probability of the entire plant still requires specific design and same-caliber evaluation.
| What to compare | Fukushima accident unit · BWR | Liquid-fueled thorium-based molten salt reactor |
|---|---|---|
| Severe accident release | High-pressure water system, damaged fuel and barriers Environment contamination has occurred in Fukushima, including air and water | Low pressure and salt can retain many fission products Design has the potential to reduce some releases |
| Still may cause contamination | Gas, particles, contaminated water Can enter the environment after crossing barriers | Leaking fuel salt, exhaust gases, tritium, etc. Still requires cooling, containment, treatment, and monitoring |
| Who has a higher probability? | Cannot use Fukushima's accident record to directly calculate a unified pollution probability for the two types of reactors. Must compare the scale, faults, barriers, site, and operational management of specific units. | |
Both types of reactors may leave long-term radioactive waste; 'using thorium' does not mean there is no nuclear contamination.Diagram and basis ↗
AHALabMMCOOL / Day TwoYou can put it this way In terms of whether radioactive substances can remain in the system, low-pressure molten salt reactors with liquid fuel have two favorable conditions: the driving force for release caused by pressure is relatively small, and the salt can retain many fission products. Therefore, they have the potential to reduce some accident releases. The Fukushima units have already caused environmental contamination in severe accidents. But this does not imply that the contamination probability of all BWRs is necessarily greater than that of all thorium-based molten salt reactors. Fuel salt leakage, exhaust gas treatment failure, and tritium migration are still pathways that molten salt reactors need to guard against. The severity of an accident's consequences depends on which nuclides are released, how much, and how they reach humans and ecosystems. Using thorium does not eliminate these problems.
Factual basis and applicable scope S1 · IAEA · Status of Molten Salt Reactor Technology (2023) https://www-pub.iaea.org/MTCD/Publications/PDF/STI-DOC-010-489_web.pdf Chapter 3: Potential advantages of low pressure and radioactive material retention, as well as R&D challenges in salt chemistry, materials, and safety analysis; PDF pages 24–33. S2 · IAEA · The Fukushima Daiichi Accident (2015) https://www-pub.iaea.org/MTCD/Publications/PDF/Pub1710-ReportByTheDG-Web.pdf Accident units, Boiling Water Reactor principles, loss of cooling after shutdown, radioactive release, and recovery work. BWR about 7 MPa, see Box 2.1, PDF page 38. S5 · IAEA · Review of ALPS Treated Water Discharge Plan (2023-07-04) https://www.iaea.org/newscenter/pressreleases/iaea-finds-japans-plans-to-release-treated-water-into-the-sea-at-fukushima-consistent-with-international-safety-standards Provided a conditional radiological impact assessment of the controlled and gradually implemented discharge plan under review at that time, and pledged continuous independent verification.
Complete comparison table and materials ./nuclear-reference.html
How to conduct onsite From existing comparative charts, illustrate how inventory, release pathways, barriers, and site conditions jointly affect the consequences. Do not rank accident probabilities where comparable data is lacking.
Move to the next page For a method to work over the long term, repeated research and collaboration among many people are indispensable. After resting, listen to Boyan explain how he got started.
Drink water, move around, look outside.
Time according to this page, continue after ten minutes.
AHALabMMCOOL / Day TwoYou can put it this way Drink water, take a walk. No new technical terms will be added after this. With the remaining time, we will choose a specific problem and design a test that can be started.
How to conduct onsite Ten-minute break. Hydration reminder, keep the screen static, do not continue presenting content.
Move to the next page When we return, we will listen to Boyan himself.
After a dive,
he began asking questions about the plastic in the ocean.
What did he initially see?
Who helped him push the idea forward?
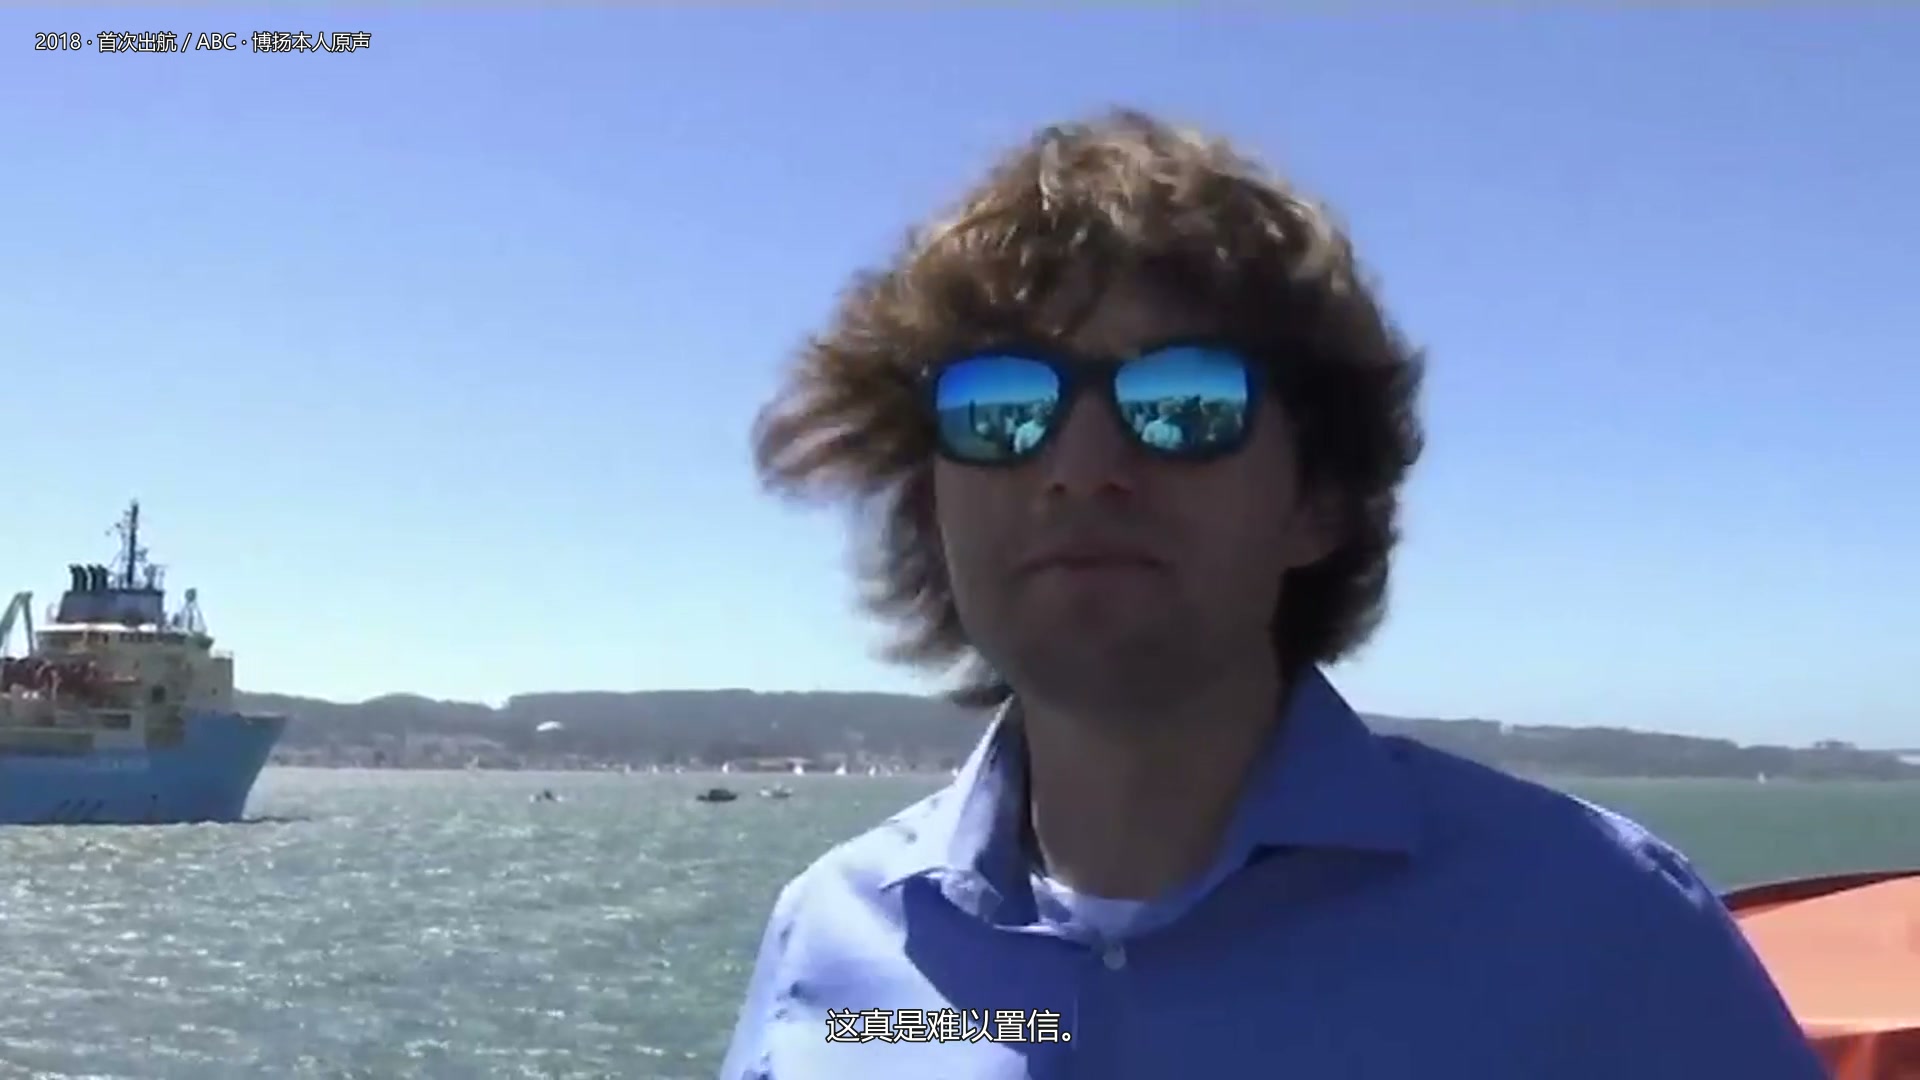
AHALabMMCOOL / Day TwoYou can put it this way Listen to Boyan's own recollection: What he saw as a young person, how he tried, and who joined him. Childhood ideas versus the systems the team later implemented should be viewed in chronological order.
Watch and follow along 3-minute clip: Select a segment from the original footage starting at his recollection, about 2 minutes; finally, listen to an impression. Platform intros differ, choose according to the scenario, no unverified unified timestamps provided.
Personal narrative https://www.wildhope.tv/episode/the-great-ocean-cleanup/
A dive made him concerned about plastic in the ocean.
Researchers, engineers, and supporters joined.
Test, maintain, fix, and accept performance evaluation.
AHALabMMCOOL / Day TwoYou can put it this way Just listened to Boyan's own story. Initial observation is important, and subsequent research, testing, maintenance, and teamwork are also indispensable. We can take one step from it: first clearly state a problem we see, then find people willing to explore it together.
Source for reference (explain as needed) ABC · Boyan Slat (2018) | https://www.abc.net.au/btn/classroom/ocean-rubbish-clean-up/10448624 From a teenage issue to team engineering; the 2018 report does not equal the complete outcome of the later project. WILD HOPE · The Great Ocean Cleanup | https://www.wildhope.tv/episode/the-great-ocean-cleanup/ Personal recollections and team actions; preserving the dates in the video.
How to conduct onsite Listen for 1 minute to a classmate recalling the original content; 1 minute to supplement about team, prototype, and maintenance. Different opinions are allowed; students are not required to follow the path of their lives. Later, use three pages to see different beginnings.
Move to the next page Boyan wants less plastic in the ocean. In Kenya, a boy is thinking simultaneously about the cows at home and the lions nearby.
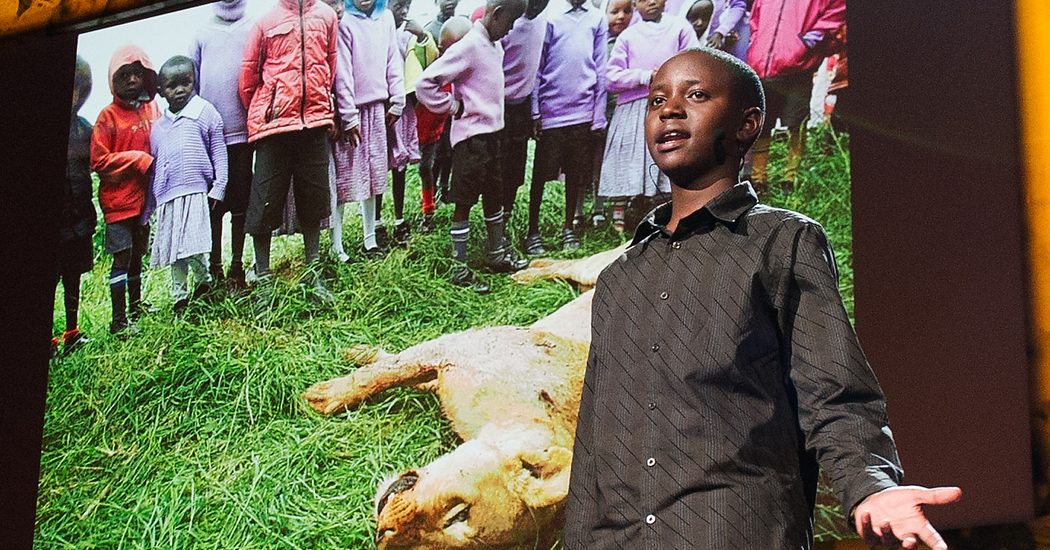
Kenya · Richard Turere
Is it possible to keep lions away from the cattle,
without hurting them?
If it were you, which part of the cattle pen would you check first?
Continue reading this story ↗AHALabMMCOOL / Day TwoYou can put it this way Boyan’s problem is in the sea, while Richard’s problem is right at his doorstep. He needs to take care of the cows at home, but lions come at night. The cows are the family’s livelihood, but harming the lions creates another problem. He noticed that when walking around the cattle pen with a light, the lions would avoid it. So he tried making a set of alternating flashing lights, making it look like someone was moving, and powered it with solar energy. Later, family members, other herders, and partners joined in. This device is suitable for careful observation: what the cattle pen looks like, where the lights are installed, and who maintains it all affect whether it works.
How to conduct onsite Total 2 minutes: about 70 seconds to tell the story, leave 30 seconds for a student to point to a place they want to observe, and the rest for transitions. The photo is from when TED was 13 telling the story; according to EPO data, he started making it at age 11. The three processes follow the existing entrance reveal, and students are not required to guess the invention. TED link is optional for the original video; the full video is not played on this page. Effectiveness of the flashing lights on other wildlife and the environment cannot be inferred from this.
Source of materials and boundaries Richard Turere At 11, created Lion Lights (EPO); at 13, spoke at TED (2013) https://www.ted.com/talks/richard_turere_my_invention_that_made_peace_with_lions The starting point was at age 11, and the TED talk age was 13. The flashing lights are not a conclusion that applies to all animals or all environments; continuous observation, maintenance, and feedback from local users are needed. Other sources: https://www.epo.org/en/news-events/press-centre/press-release/2023/732589 Image source: TED 2013 talk cover; the image is from the talk, not the site when it was made at age 11. https://pi.tedcdn.com/r/pe.tedcdn.com/images/ted/1d369b73bf27ebdb1450605454d66229bda2ab1c_1600x1200.jpg?u%5Br%5D=2&u%5Bs%5D=0.5&u%5Ba%5D=0.8&u%5Bt%5D=0.03&quality=82&c=1050%2C550&w=1050 Image copyright belongs to the original rights holder; image source and usage scope see material instructions, not created by AHALab or under CC BY license.
Move to the next page Richard started with troubles at home. For others, the starting point was simply an interest in the small lives around them.
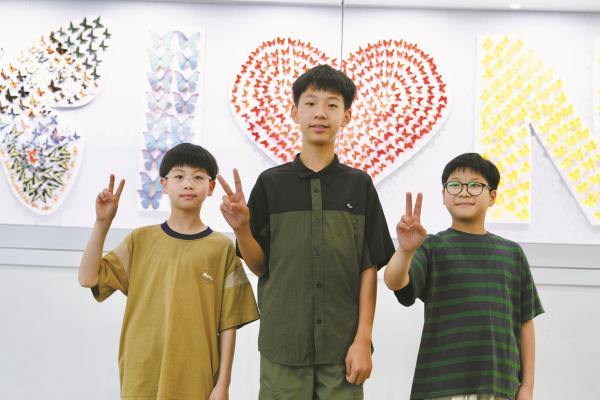
Some organize campus insect exhibitions, some make videos,
Some write down their observations. Family, peers, and museums participate together.
After knowing its name, what else do you want to know?
Continue watching stories around you ↗AHALabMMCOOL / Day TwoYou can put it this way The three youths on the left from Ningbo like insects. They observe, research, some make exhibitions, some make science videos, and then share their discoveries with others. At the time of reporting, they were 10, 11, and 13 years old. The story on the right is from another school: students at Changshu UWC noticed birds hitting glass on campus, so they continuously recorded collisions during migration season, consulted researchers, and worked with the school to put up bird collision prevention stickers, then monitored the situation. They also created a campus birdwatching website. The two stories do not need the same starting point: one can start by liking an insect, or by noticing an injured bird, and then continue to learn more.
How to conduct onsite Total 2 minutes: Use a real group photo to tell the Ningbo story, with Changshu UWC marked independently on the right to avoid misidentifying them as the same team. About 80 seconds for narration and 20 seconds to hear a follow-up question. If students are interested, they can freely explore and continue reading the original text during the remaining 12 minutes. Here, just confirm continuous observation, collaboration, and implementation actions; statistics from different seasons cannot be taken as causal proof that the stickers reduced bird collisions. Observation focuses on photography and recording, without assigning collection tasks.
Source of materials and boundaries Ningbo Young Insect Enthusiasts: Chu Nanqin, Li Yuyan, Shi Zexing Ages 10, 11, and 13 at the time of reporting in 2024 https://www.zast.org.cn/art/2024/7/19/art_1674358_58973084.html This is a case of interest, sharing, and observation; it does not fabricate the effectiveness of endangered species protection. The exhibition includes catching, breeding, and specimens; classroom guidance prioritizes observation, photography, and information research, and does not encourage random collection for completing projects. Other sources: https://zjnews.zjol.com.cn/202407/t20240715_30407643.shtml Image source: Group photo of the three young insect enthusiasts in the Zhejiang News report of July 2024. https://meizi-zjol-1577-pub.zjol.com.cn/zjxw/202407/1812733532899450880_1280px.jpg Image copyright belongs to the original rights holder; sources and usage are as indicated in the material description, not created by AHALab or under CC BY license. Gu Zexing, Sui Jialiang, and Changshu UWC Bird Conservation Practical Team High school level; surveyed from 2022–2024, specific ages not publicly verified https://www.uwcchina.org/show/884 “8 in spring, 2 in autumn” is self-reported observation by the school, not a controlled experiment, and cannot claim that stickers reduced bird collisions by 75%. Different seasons, bird traffic, and observation conditions may vary; photos retain the school's original source.
Move to the next page Paying attention to the surroundings also includes noticing the people around you. There is a story where the action was repeatedly meeting someone.
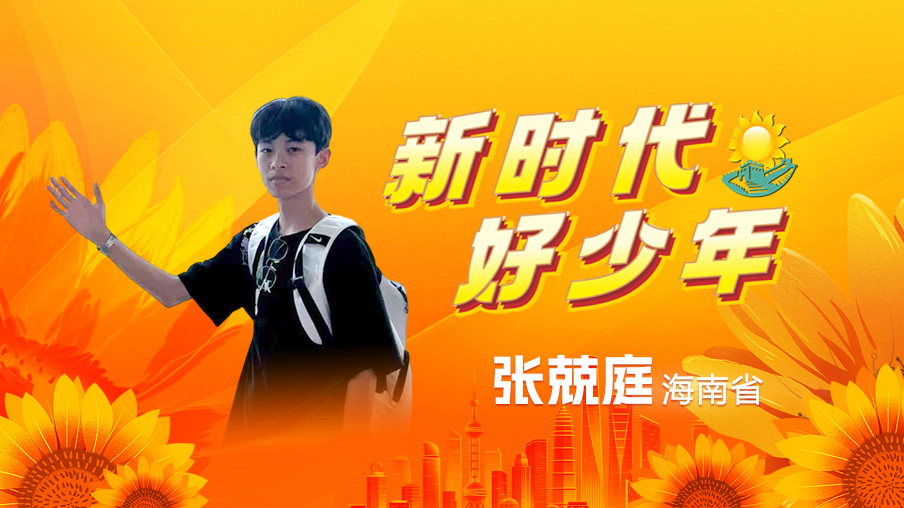
14 years old at the time of reporting · with family and volunteer partners
What does the other person want to talk about today?
How can we know?
Volunteering from a young age, continuously visiting the elderly,
Also participates in helping children in need.
It takes time to get to know someone.
If you were to meet an elderly person you are not familiar with, how would you start a conversation?
More teen stories ↗AHALabMMCOOL / Day TwoYou can put it this way Zhang Jingtian lives in Hainan. In a 2025 report, he was 14 years old and had already participated in public welfare activities for many years with his family and volunteer partners. He would go to nursing homes and also help children in need. This story makes me want to ask a bit more: the first time we meet someone, we might only know their name. It’s only after spending time with them that we may know what they like or what they have been worrying about recently. But this still requires listening to the other person tell us themselves. Suppose we go visit an elderly person with a prepared activity but find that they just want to chat today — what would we do?
How to conduct onsite Total 2 minutes: about 50 seconds introducing facts, 50 seconds listening to one or two ways to start a conversation, and finally 20 seconds for transition. This does not require students to sign up for volunteer service, nor is public welfare experience ranked among people. Age 14 refers to the report in September 2025, starting at age 5, nine years of experience are according to the original text. The 5 min 23 sec original Chinese video is optional for further exploration and can be played according to students’ interest; this page only uses the real cover and narration to avoid taking up discussion time. The online original has been spot-checked for playback, not yet reviewed segment by segment.
Source of materials and boundaries Zhang Jingtian Started volunteering at age 5 (2016); 14 years old, eighth grade as of the September 2025 report http://www.wenming.cn/wmzthc/20250910/a2a033360bf44714941d2332c78246ab/c.html According to the September 2025 report, it should be 9 years of public welfare experience, not “more than ten years.” The age is not the current age; the number of service instances and beneficiaries is according to the report, without independent audit.
Cover image source The cover of the Zhang Jinting entry directly linked from the 2025 special page of the China Civilization Network; not called the video frame extracted from this material. http://www.wenming.cn/wmzthc/20250910/a2a033360bf44714941d2332c78246ab/cdfeb37eb43643dcbbb6a6effd67025f.jpg Image rights belong to the original rights holder; source and rights see material description.
Move to the next page Among these stories, some people create installations, some observe nature, and some keep meeting a person. Which one would you like to continue hearing about?
Which story do you want to follow further?
Which method do you still have questions about?
If you could meet one person in the clip, what would you like to ask?
You can talk about interests, or you can talk about different opinions. It's okay if there are no answers yet.
AHALabMMCOOL / Day TwoYou can put it this way Now let’s hear from you. You don’t have to propose a plan to change the world, you can just talk about one thing you want to know, or one aspect you don’t quite agree with. You can also first chat with the classmate next to you, then decide whether to share with everyone.
How to conduct onsite 1 minute for pairs to communicate, 4 minutes to listen to voluntary contributions and responses from classmates. Leave the questions, no scoring or action commitments here.
Move to the next page I also have some such questions. Next, open the workshop and share a few projects I am working on.
Think of a need, check information, create it, take it back to the real scene and see again.
AHALabMMCOOL / Day TwoYou can put it this way Just now, some people started from a single dive, some started from cowsheds, insects, and school windows, and some got to know others' needs through repeated interactions. The projects here also have such concrete starting points: wanting to give more support to people entering the mountains, wanting to know the birds around, wanting to record familiar spaces. During the process, the original ideas will also constantly change.
How to conduct onsite 1-minute transition, not promoting results. When introducing what is being done, distinguish between prototypes, existing demonstrations, and capabilities intended for the future.
Move to the next page First answer that opening question: why put AI into a box that can be taken into the mountains?
Leaving a location also requires thinking about how messages reach people.
Which knowledge and skills can be carried with you?
Respond to a sentence, catching the momentary tension and loneliness.
Could there be minerals here? Where else can clues be found?
AHALabMMCOOL / Day TwoYou can put it this way You are in the mountains, walking to a fork in the road, and realize that you have lost your companions, and your phone has no signal. At this moment, what kind of help do you want? Perhaps it's letting your companions know your location, or maybe it's someone responding, making you feel less anxious. Or it could be that you haven't encountered any danger along the way, just continuously curious: What kind of plant is this? Who was calling just now? Why is this rock like this? Are there any minerals in this area? I want to make Box because I hope these needs for safety, communication, and exploration can be taken seriously.
How to conduct onsite Looking back at the ideas on the whiteboard at the beginning, please have two or three people choose a scenario to supplement. This page presents the needs that the design aims to address and does not claim that the listed wishes have been fully achieved. The mountain scenario is used to discuss the design and does not involve organizing actual lost-person or offline wilderness rescue experiments.
Move to the next page Different needs require different approaches. I have broken them down; some have already been prototyped, while others are still being tested.
Related projects For the usage scenarios and capability description of the Cangshan Watch Box, see project-reference.html#box.
First know and note down where you are,
Double-check who the message can reach.
Try local voice and knowledge,
Let conversations rely less on the internet.
From the bird in front of me, a stone,
Find questions worth continuing to investigate.
On-site, choose one of the questions you just raised and see how this prototype responds.
Being able to locate, send the location, and have someone receive it are three things that need to be confirmed separately.
AHALabMMCOOL / Day TwoYou can put it this way I will break it down into several tasks. Positioning and recording are responsible for leaving clues; communication is responsible for sending the clues to people. The voice part allows people to speak directly, with some knowledge and models stored locally. The camera and audio capture problems encountered along the way. Now let's pick one of the questions you just asked and see how this prototype responds. If it can only provide candidates, requires network connection, or cannot answer, I will also state it truthfully.
How to conduct onsite The first two minutes should discuss the correspondence with the design; the last three minutes are for the teacher to use functions confirmed available before class for a natural Q&A or picture demonstration, leaving time to answer student follow-up questions. If the device is not ready, play an existing demonstration and explain what it can currently do and its limitations. Do not trigger a real SOS or change the device network configuration.
Move to the next page In the mountains, after asking "What bird is this?", if you want to continue learning, we can open Project Avis.
Things the speaker needs to distinguish Explain GNSS positioning and external communication separately; emotional responses are a design requirement and should not claim therapeutic effects or replace real companionship. Regarding minerals, the demonstration is for description and research, not for concluding mineral deposits from a single photo.
Project Avis · One square kilometer of bird soundscape
Leave time, location, and original records.
Unrecognizable ones are also kept in the records.
Listen to bird sounds, look at photos, rotate and view models.
The other side not captured by the photo, is it observed, or filled in by AI?
AHALabMMCOOL / Day TwoEnter your own project from a conservation case Just now we saw how professional teams monitor birds. Our designed Project Avis wants to start from one square kilometer in a school, community, or park, recording bird sounds, taking photos, and asking which birds are here and when they appear. AI can provide candidate names; recordings and photos need to be kept, and humans still need to verify. To encourage others to learn about them, we also made a migratory bird big screen, putting photos, bird sounds, and rotatable models together.
Explain while playing This segment is a rotating display of bird models already generated in AI-Whiteboard. Select a bird photo and use TripoSplat to generate a 3D figure made up of many points with color, size, and direction information, then show it via Gaussian splatter. Rotate it to see: the side not captured in the original photo is completed by the model based on learned shapes. It is suitable for display and curiosity; if you want to study feather details or bird anatomy, you still need to go back to real photos and observations.
Local migratory bird display stand https://www.zimablueai.com/project-avis.html
How to conduct onsite Display selected rotation clips of existing bird whiteboard models; click the migratory bird big screen to rotate models. Distinguish between observation records, candidate identifications, human verification, and display creation; a single image generated to complete the model is not measured.
Move to the next page Like the students from Changshu UWC earlier, recording can help people understand a place. The next project involves using mobile phones to record the spaces we are familiar with.
Silver Age Future Lab · Starting from routes and spaces familiar to the elderly
Where is the route? What will you see after turning a corner?
Follow the footage to find the same doorway.
The model must match the captured places.
If you want to use it as a correspondent map, which part would you most want to verify first?
AHALabMMCOOL / Day TwoFirst explain why it is done The Silver Age Future Lab is concerned with how the elderly live and move in familiar places and what assistance they themselves need. We have designed a correspondent map, and we are also studying, with the person's consent, creating 3D records of familiar spaces. By filming a video along a route with a mobile phone, one can attempt to combine multiple perspectives into a space. Here we present our existing reconstruction recording: on the right you can see the footage from the original video, and on the left is the spatial result.
Pause at a place while playing Please focus on a doorway or a corner: what was it like in the original video, and can it still be found in the model? You will see that some parts have already been connected, while other parts are still missing. In this demo, you can rotate the view and check the original scene; it shows the browsing process after reconstruction. As for whether you can measure dimensions or have the machine follow the layout, that requires separate testing.
Watch the reconstructed clips on the phone media/phone-reconstruction-public.mp4
How to conduct onsite Play 47.96 seconds of phone reconstruction recording. It explains that this is a spatial recording attempt related to the Silver-Haired Future course; distinguish LingBot-Map from ABot-Recon. Ask who the recorded space is for and which details need actual verification, and you can open the existing reference page.
Move to the next page Just now it was recording an existing room. Designing the online workshop, however, starts from the shape and function.
Blender / bpy modeling → export GLB → roam and click in the webpage.
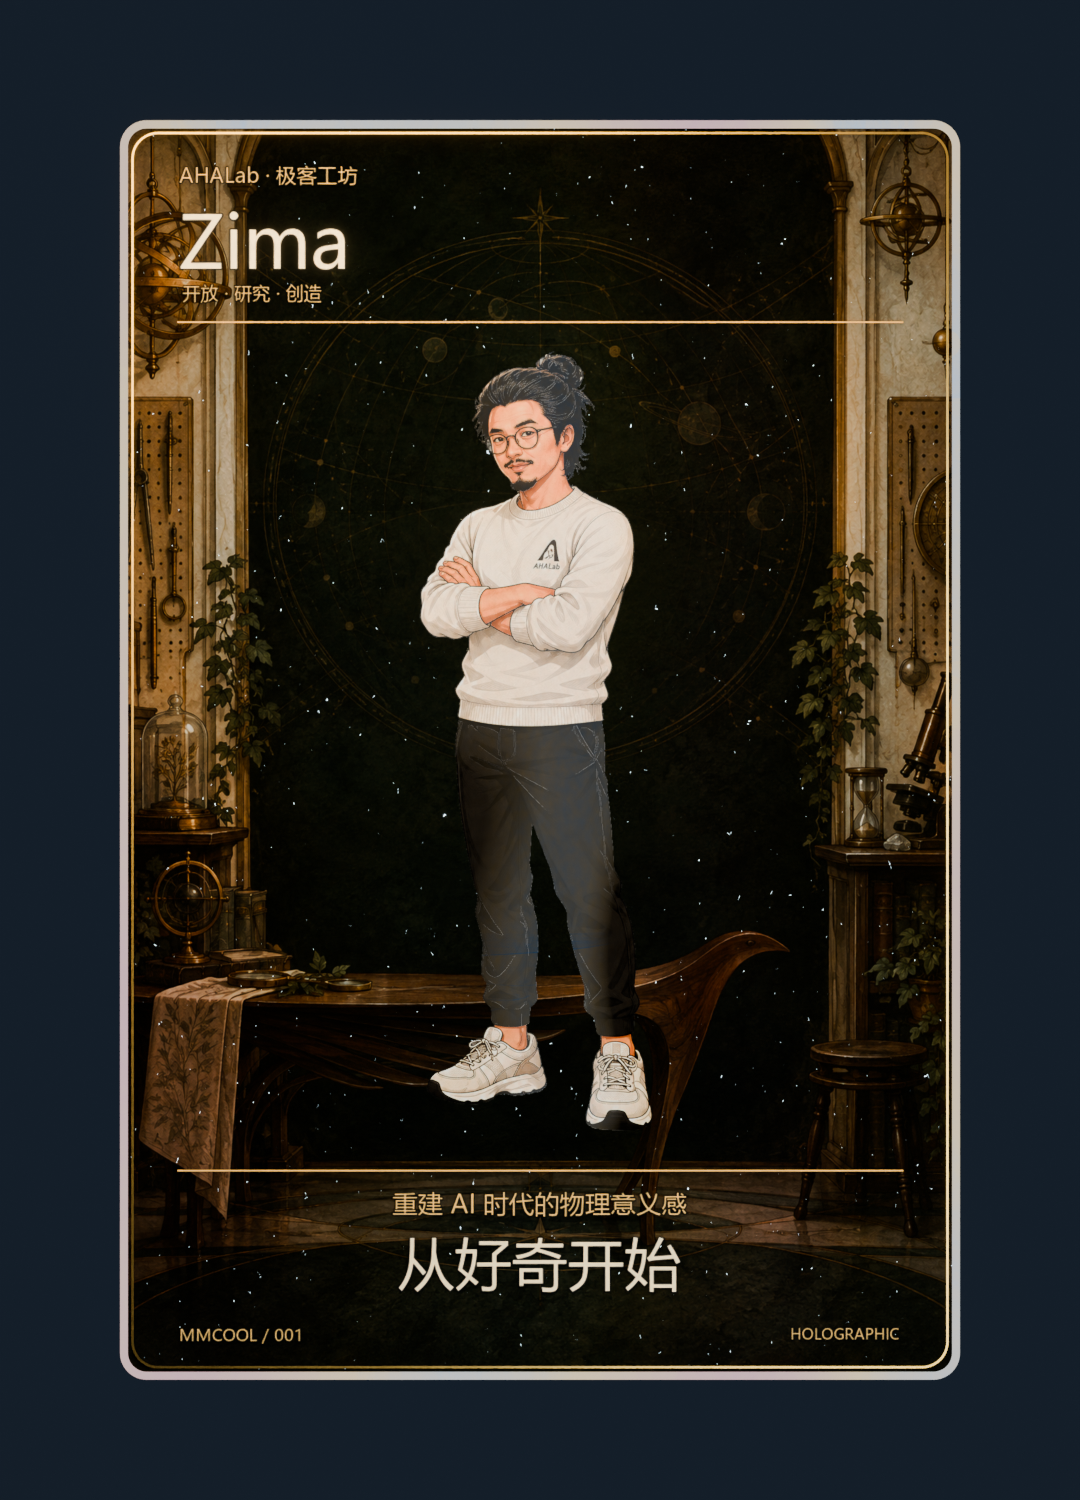
How do characters, backgrounds, and reflections each move?
AHALabMMCOOL / Day TwoFrom recording real spaces to designing Just now we used a camera to record real spaces. 3D has another approach: design first, then assemble it. Both of our websites make the scene the entry point. Here is AHALab's online workshop: rooms, flying bird desk, whiteboard, and printer, placed into a Blender scene according to the design; bpy is Blender's Python interface, we use code to specify size, position, and material, then put the model on the webpage. Roaming and clicking in the webpage are handled by tools like Three.js.
Let the students move a bit Look at this card again, I made a holographic flash card from my own illustration. I invited a student to turn it: drag left and right, flip to the back, and adjust the glossiness. Notice if the character and the background move together? Why does the text still stick to the edge of the card? This is the effect of layered images, parallax, and reflections working together. The character itself has not been reconstructed as a fully viewable 3D entity.
Open local holographic flash card demos/holocard/index.html
How to conduct onsite Demonstrate online workshop roaming and flash cards, about 30 seconds each. Blender/bpy is for code modeling, the webpage handles interaction; do not describe layered flash cards as real human 3D reconstructions.
Move to the next page From these projects, we also organized courses that can be conducted together.
Listen to a place, recognize birds, and share records with others.
View course ↗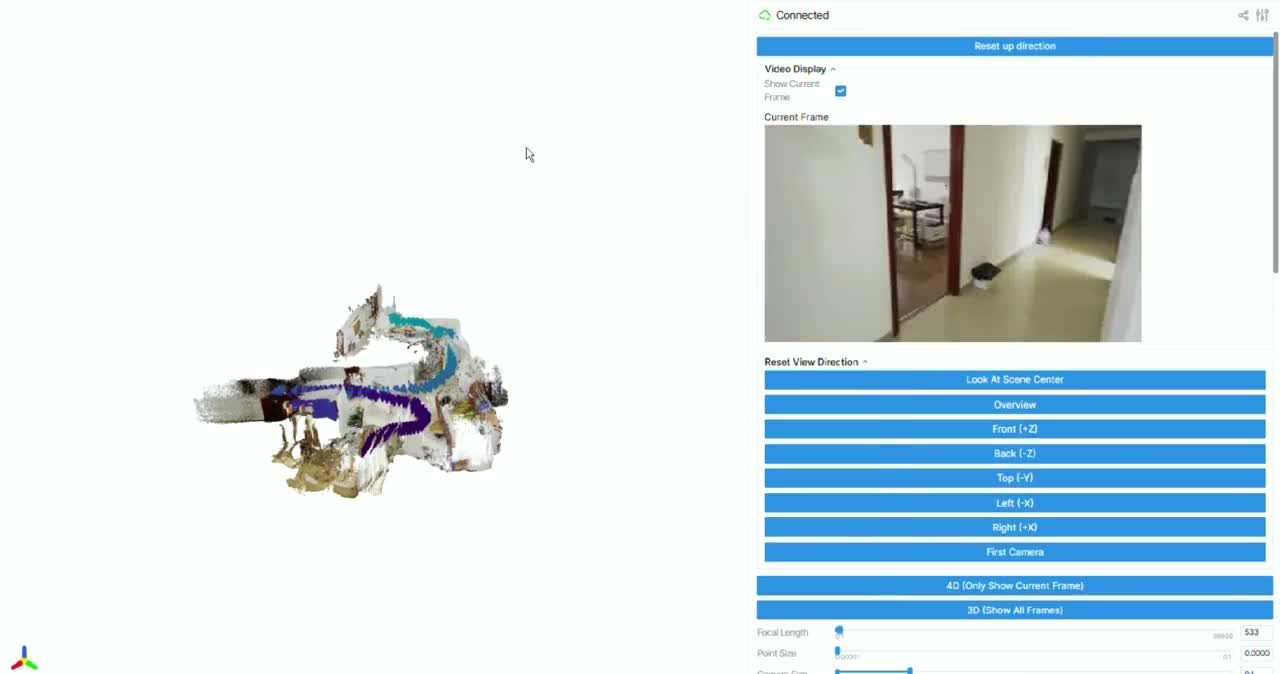
First listen to the needs of the elderly, then design, test, and modify together.
View course ↗Focus on location, maps, and communication to create checkable prototypes.
View course ↗Investigate together, divide tasks, create, and then listen to user feedback. Learn whatever knowledge is needed seriously.
AHALabMMCOOL / Day TwoYou can put it this way These are the courses we have already designed, which can be accessed from different entry points. Project Avis revolves around birds and a particular place; Silver Age Future Life Lab first listens to what older adults need; Cangshan Watch research maps, locations, and communications to see how they can be useful. PBL allows a problem to continue over a period of time, where everyone investigates, learns, and creates together, then revises afterward. Each person can take on different tasks, and will also need teammates.
How to conduct onsite 2-minute follow-up to D1's PBL: Use the three projects discussed to explain one course entry each, emphasizing how investigation, division of work, creation, and feedback continue. The next page introduces the weather and climate course separately, without crowding more cards on the overview page. Distinguish between course design and implementation results.
Move to the next page We talked about weather and climate earlier, and we have also designed courses around them. Start by talking about a shady spot around you.
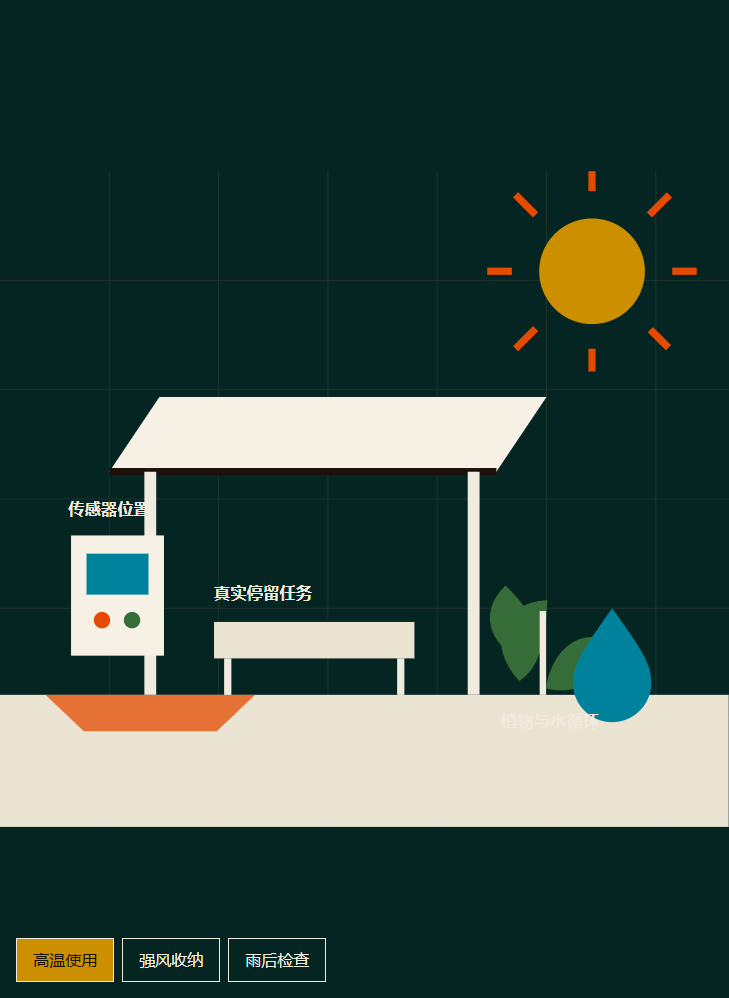
Urban Cool Island Design Bureau · Weather Forecast Hackathon
Such as an elder waiting for children, someone standing at the entrance,
or a student who walks this path every day.
Compare shading, materials, and ventilation;
Record surface temperature, air temperature and humidity, and human feelings.
Compare prediction methods using historical data, and reveal results after submission.
Once there is a forecast, discuss when to deploy and when to store.
In the places you often go, where needs shade the most?
Courses and play ↗AHALabMMCOOL / Day TwoYou can put it this way The recent class began with the needs of birds, elders, and people in the mountains. Weather can also start from a specific person: for example, the person guarding the entrance or a student waiting for the bus under the sun every day. We designed an urban cool island course, first asking where it feels uncomfortable, then measuring and comparing shade, materials, and ventilation, creating a small prototype for users to try. This course also includes a weather prediction hackathon: participants are given historical data and a period of unseen answers, then compare their own methods with AI-assisted methods. Results are revealed after submission to see where judgments went wrong. Finally, students consider what the installation and users need to do when high temperatures, strong winds, or rain are predicted.
How to conduct onsite 2-minute introduction: 60 seconds to talk about users, measurements, and blind weather testing, 30 seconds to open the cool island interface and switch between “use during high temperature/pack up in strong wind,” 20 seconds to describe a nearby location, and 10 seconds for transition. A full hackathon is not organized here, nor are students required to decide on courses on the spot. Two modeling routes can pair two people, dividing responsibilities according to actual capability.
Existing designs and tools Based on curriculum-plan.md, weather-climate-extension.md, hackathon-design.md, and software/weather/HACKATHON-README.md from 20260718-urban-cool-island-pbl. Six main cool island lessons and three weather hackathon designs already exist, along with data acquisition, time segmentation, baseline, and scoring scripts written in the Python standard library; verification files exist in this material and interface documentation, but full training and scoring have not been rerun. Existing records support the course development status but do not support the existence of already built cool islands, courses already implemented in class, or achieved cooling effects. The 44°C in the original project name is the scenario entry, not the actual measured temperature.
The scientific boundaries of measurement and climate Air temperature, surface temperature, and thermal sensation are different quantities. Try to compare at similar times and using the same measurement method, re-measure multiple times, and record humidity, wind, sunlight, and user feedback; Do not attribute all temperature drops to the device. This project connects thermal adaptation and microclimate; a single campus measurement cannot prove long-term climate change. The original course Sky Branch uses long-term data to discuss ENSO and climate trends, retaining seasonal background and the distinction between weather forecasts and long-term variation. Thermal environment reference: https://www.weather.gov/safety/heat-index.
Historical weather data and demonstration caliber Verified data meta information: NASA POWER Daily Point, Guangzhou public demonstration grid, 2020-01-01 to 2025-12-31, 2192 days, retrieved 2026-07-19. This is grid point reanalysis and other data, not observations from campus meteorological stations or real-time forecasts; Source: https://power.larc.nasa.gov/docs/methodology/meteorology/. The original course includes more data channel designs. The probability, path, and ranking lists in the current packaging interface are preset teaching examples. This material has been explicitly stated and does not claim real-time button training or generated scientific test results. Serious comparisons require limiting the same input and prediction timeliness, retaining test segments not involved in training/parameter tuning; Six years of samples cannot be used alone for long-term climate trend conclusions.
Local demonstration demos/weather-courses/cool-island/index.html。 The main map can switch to three installation states, #hackathon shows two routes; For the full course and reference, see weather-projects.html#cool-island.
Move to the next page If you look further out from this square meter, where will the rain pass, and whose travel or farmland will be affected? This is where the maps and spatial records mentioned earlier come in.
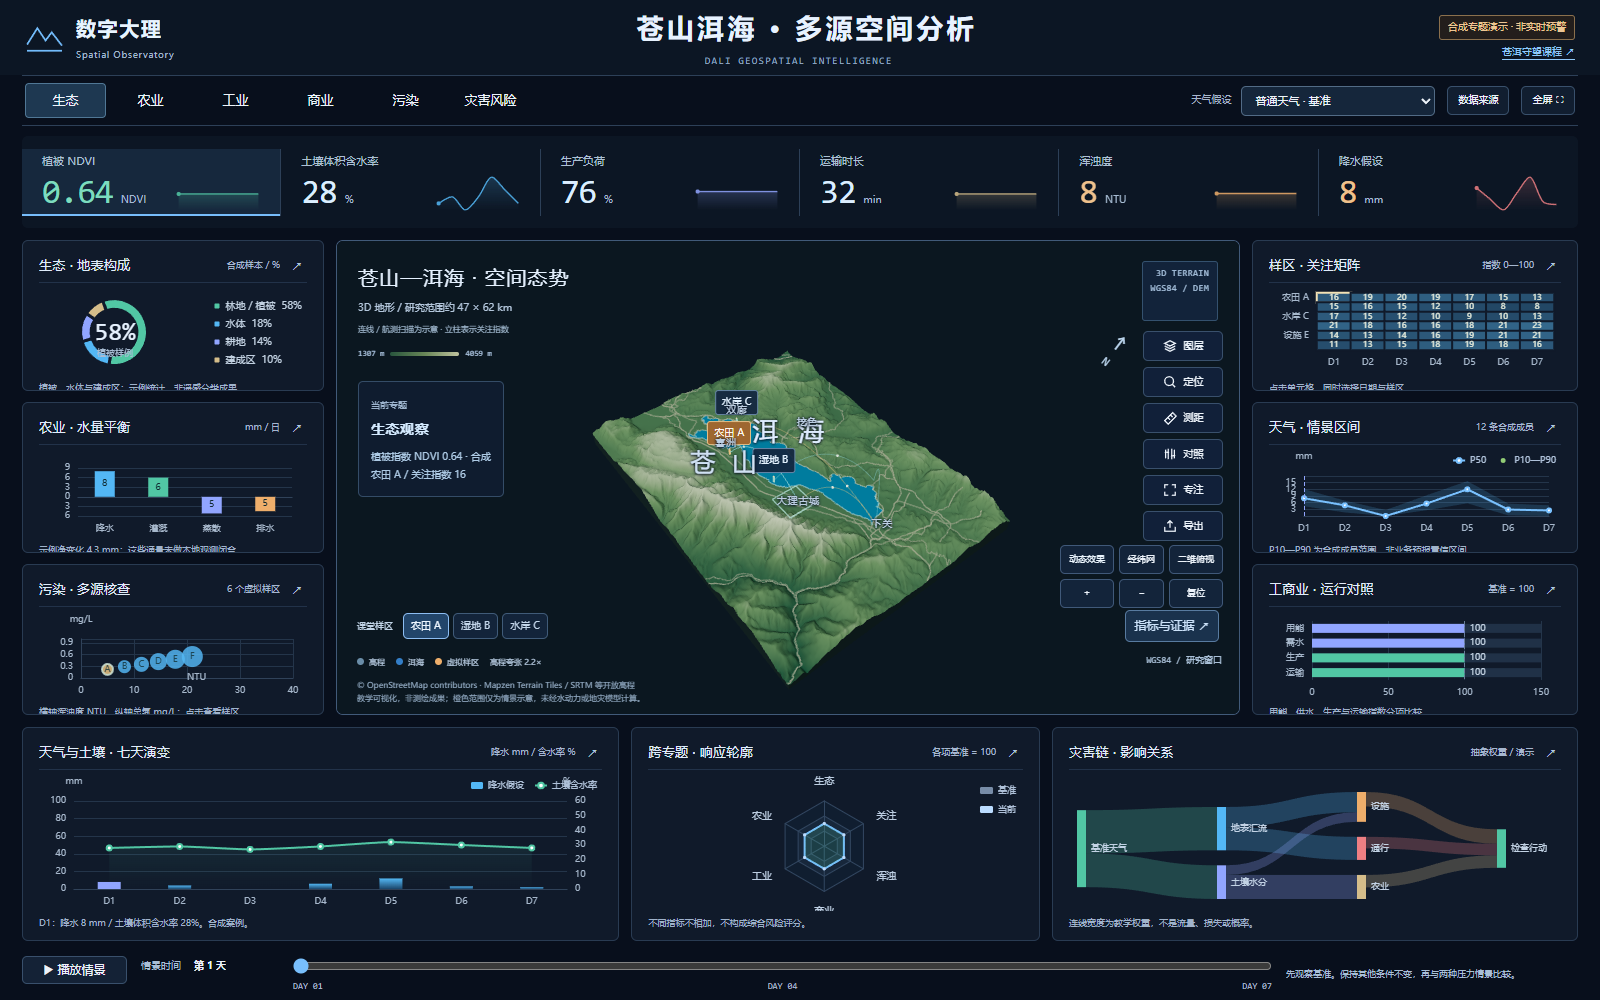
Cang'er Watch · Spatial Intelligence and Climate Action Lab
Maps, photos, and ground records,
put roads, farmland, and people back in place.
The same rain, different terrain, drainage, and usage,
the impacts worth questioning are also different.
Record predictions in advance, then verify later;
make a small improvement, then see if it works.
If you choose one place for continuous observation, where would you choose?
Projects and Courses ↗AHALabMMCOOL / Day TwoYou can put it this way Just now, we left a 3D record of the space with a mobile phone, and Box is also tracking where people are. If you add the weather to the map, what new issues arise? This is the digital Dali interface we created, which is also a tool used in the Cang'er Watch course. First, choose a place you can visit repeatedly, identify it using maps, photos, and measurements; then discuss how the weather might affect people, roads, or farmland here. The topic values on the screen are synthetic scenarios, which we use to practice seeing relationships. For actual course implementation, you also need to collect on-site and historical data, record judgments in advance, then verify later; if a small improvement is made, continue revisiting to see if it is effective.
How to conduct onsite 2 minutes: 35 seconds to show location on the map, 40 seconds to connect weather, terrain, users, and observations, 35 seconds to let one or two students choose a place for repeat visits, 10 seconds for free exploration. If using a large screen, just demonstrate rotation and one weather scenario switch; do not go through each dashboard number, nor interpret indicator levels as real risk.
Current status of courses and projects The Cang'er Watchcourse has already formed twelve lessons, two workshops, a research protocol, and worksheets, but still needs trial teaching for verification. Digital Dali is an independent project: public materials introduce maps and weather scenarios through screenshots, retaining sources and simulated boundary descriptions. The full project implementation is not provided with this course; the course introduction does not imply that Box has completed integration with the map or weather system.
Real geography and synthetic scenarios must be distinguished The terrain comes from open elevation data, and the map includes OSM lakeshores and roads; display with sampling and exaggerated elevation does not equal precise surveying. Weather, agriculture, industry, pollution, and risk numbers are teaching synthetic data and cannot be used to judge actual disaster, pollution, or production stoppage in a place. The current map has not implemented verified hydrodynamic flood simulations, debris flow predictions, or local business early warnings. Switching to a heavy rain scenario is operating existing assumptions and cannot be taken as evidence that the model forecast is more accurate. Agriculture and disaster impacts also depend on land, drainage, facilities, and human activities; arrows should indicate mechanisms and evidence, and related changes are not to be directly taken as causal.
From weather to climate The long-term part of the course understands background changes through continuous revisiting, historical data, and ENSO knowledge packages. A single rainfall or a few interface scenarios are discussed separately from long-term climate trends; no direct attribution of a single event to global warming. When no disaster occurs on site, historical case studies are used with their year noted, not waiting for disasters or arranging tests in dangerous areas. The focus here is on how the course learns, not on existing predictive capabilities.
Observe the project interface project-reference.html#digital-dali; the introduction page explains the difference between geographic data and synthetic topics. Course introduction: weather-projects.html#canger.
Move to the next page These directions can all be developed gradually. Leave some time now; you can continue looking at the issues on the map, try weather experiments, or go back to Box, birds, or the video you just watched.
Which usage scenario still needs to be thought through?
Retrieve that scene and see what else you want to know.
Look at photos, listen to descriptions, and then compare with how it looks in 3D.
You can also continue asking questions from the video. There’s no need to finish a project today.
AHALabMMCOOL / Day TwoYou can put it this way Now let's give the time to everyone. You can watch together or pair up in twos. Talk about a scene in Box, review a video, get to know a bird, or open the earlier Liángdǎo and 3D map. You can also raise other questions. Choose a direction you’d like to explore further and find a partner who wants to watch with you.
How to conduct onsite 2 minutes for students to jointly select a direction, 8 minutes for table exploration or pair discussion, 2 minutes to leave an observation or question. If there are two devices, you can use them in pairs; if only a projector is available, watch the same screen together and rotate voluntarily. Only use confirmed available device capabilities; no need to submit a plan.
Move to the next page If you’re willing, share what you just discovered.
We just noticed…
I originally thought… now I still want to confirm…
After hearing your thoughts, I want to add…
Listen first, then follow up. You can bring one question; no need to bring a conclusion.
AHALabMMCOOL / Day TwoYou can put it this way No formal report is needed. You can talk about one discovery, one thing you didn’t understand, or an interesting question a partner just raised. Others listen first, then add one more sentence or ask one more follow-up.
Teaching prompts Voluntary sharing around the table, 8 minutes in total. Two people can add to the same finding; you can also just pose questions. Adjust according to the number of people; no ranking or formal reporting required.
Move to the next page These unfinished questions can be continued later.
Who is using it? Who can do it together?
What can we provide for each other?
A bird, a stretch of road, an object,
Can all be explored further.
Leave the questions you still want to discuss. You can also tell me later.
AHALabMMCOOL / Day TwoYou can put it this way In future workshops, I want to gradually develop courses with everyone around two types of relationships. One is with others: how we collaborate, how we hear another person's needs, how we make things useful to people. The other is with the world: observe and create firsthand, see how real materials, places, and life respond to our ideas. You don’t have to decide today what to do. You can leave a question, or come back to discuss next time, either way is fine.
How to conduct onsite 3 minutes: first 1 minute to explain the two long-term directions—relationship with others and relationship with the world—followed by 2 minutes for final questions. Retain the previous 5 minutes for student questions, 12 minutes for free exploration, and 8 minutes for peer sharing. Do not call on anyone to pursue interests or require commitments.
Move to the next page Keep students' questions at the end and return to them next time.