 Weather, Climate, and the Places We LiveBack to D2 slides ↗
Weather comes to us,
What can we do together?
These are two sets of courses already designed by AHALab. You can start from a shady spot or from a place you are willing to observe repeatedly. The courses connect measurement, modeling, hands-on activities, and feedback from others.
One square meter, who can it make a little cooler?
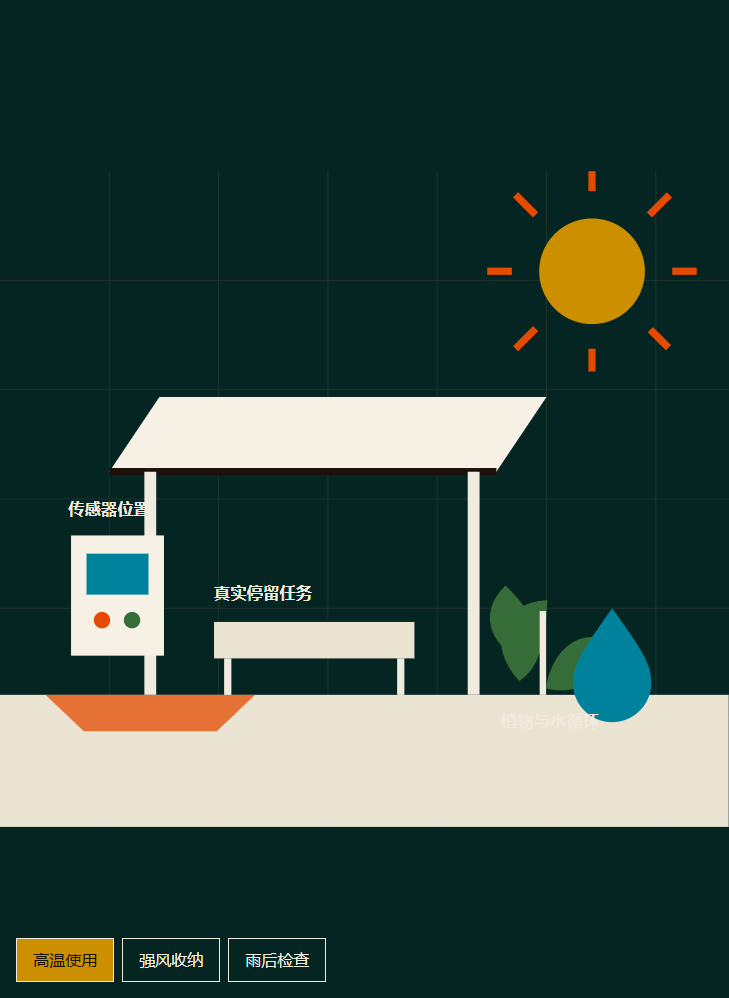
Urban Cool Island Design BureauStart from the real needs of users: some need to guard the entrance, some are waiting for the bus, and some are waiting for their children to finish school.
- Observe who stays here and when they feel most uncomfortable.
- Record air temperature and humidity, surface temperature, sunlight, wind, and human sensations separately.
- Compare methods such as shading, materials, and ventilation, and create a small prototype.
- Pair and retest under similar conditions; ask users to try it, provide feedback, and then revise.
“Feeling cool,” “seat surface cooling,” and “air cooling” each describe different things. We need to be clear about what each measurement actually measured.
Weather Forecast Hackathon: Submit your answer first, then reveal
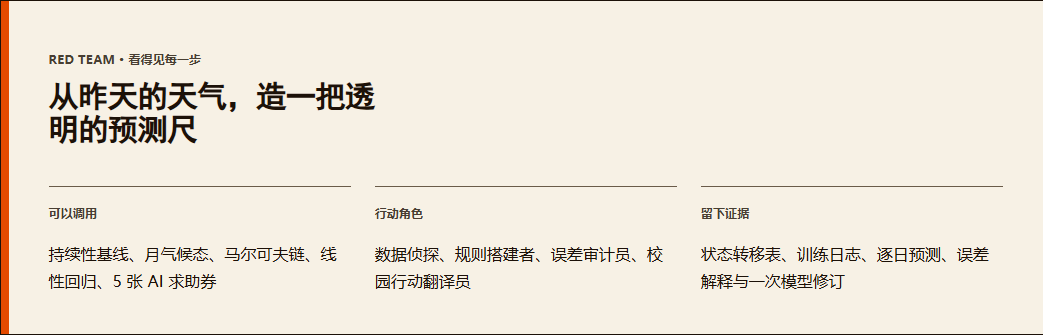
One route starts from simple rules that can be explained; the other route uses AI to learn, write code, and revise. Using the same data and the same prediction goal, keep a portion of data not involved in training and tuning. Submit first, then review the results. If the model doesn’t outperform the simple method, it is still worth investigating why.
High-Temperature Use
Where is shade, water, and rest needed?
Strong Wind Storage
When should the device be stopped and stored?
Post-Rain Inspection
Who checks water accumulation, structures, and the ground?
What has already been prepared, and what still needs to be done?
There are already six Cool Island mainlines, three Weather Hackathon designs, as well as data acquisition, time segmentation, transparent baselines, and scoring scripts. On-site facilities, actual teaching, and local effects still need to be implemented, recorded, and verified. This presentation does not claim to have completed construction, implemented this class course, or achieved cooling results.
The retained NASA POWER demo package covers one grid point in Guangzhou from 2020 to 2025, totaling 2,192 days. Meteorological parameters come from grid reanalysis and other data, and the spatial coverage they represent differs from campus observations; historical data is also not equivalent to real-time forecasts.NASA POWER method description。
Heat perception is also affected by humidity, wind, and radiation. Air temperature cannot replace all thermal environment indicators; the course should retain the distinction between instruments, measurement methods, environment, and personal sensations.Thermal environment indicators explanation from the U.S. National Weather Service。
Small campus experiments study local thermal environments and adaptation methods. The original course also has branches on long-term climate, ENSO, and weather scales; a single campus measurement or six-year sample cannot independently derive long-term climate trends.
What happens if the same rain falls in different places?
Cang'er Watch · Spatial Intelligence and Climate Action LabConnect the maps, 3D records, weather, and real users that we have already discussed.
Understanding a place
Mark precise locations and verify the map with photos and ground records. Who lives, works, or passes through here?
Leave verifiable judgments
Make predictions based on the information available at the time, save the submission time, and then compare with later results.
Go back to see if it is useful
Conduct a limited improvement, pair retesting, and listen to feedback from actual users.
If you choose one place for continuous observation, where would you choose?
How to understand courses and tools
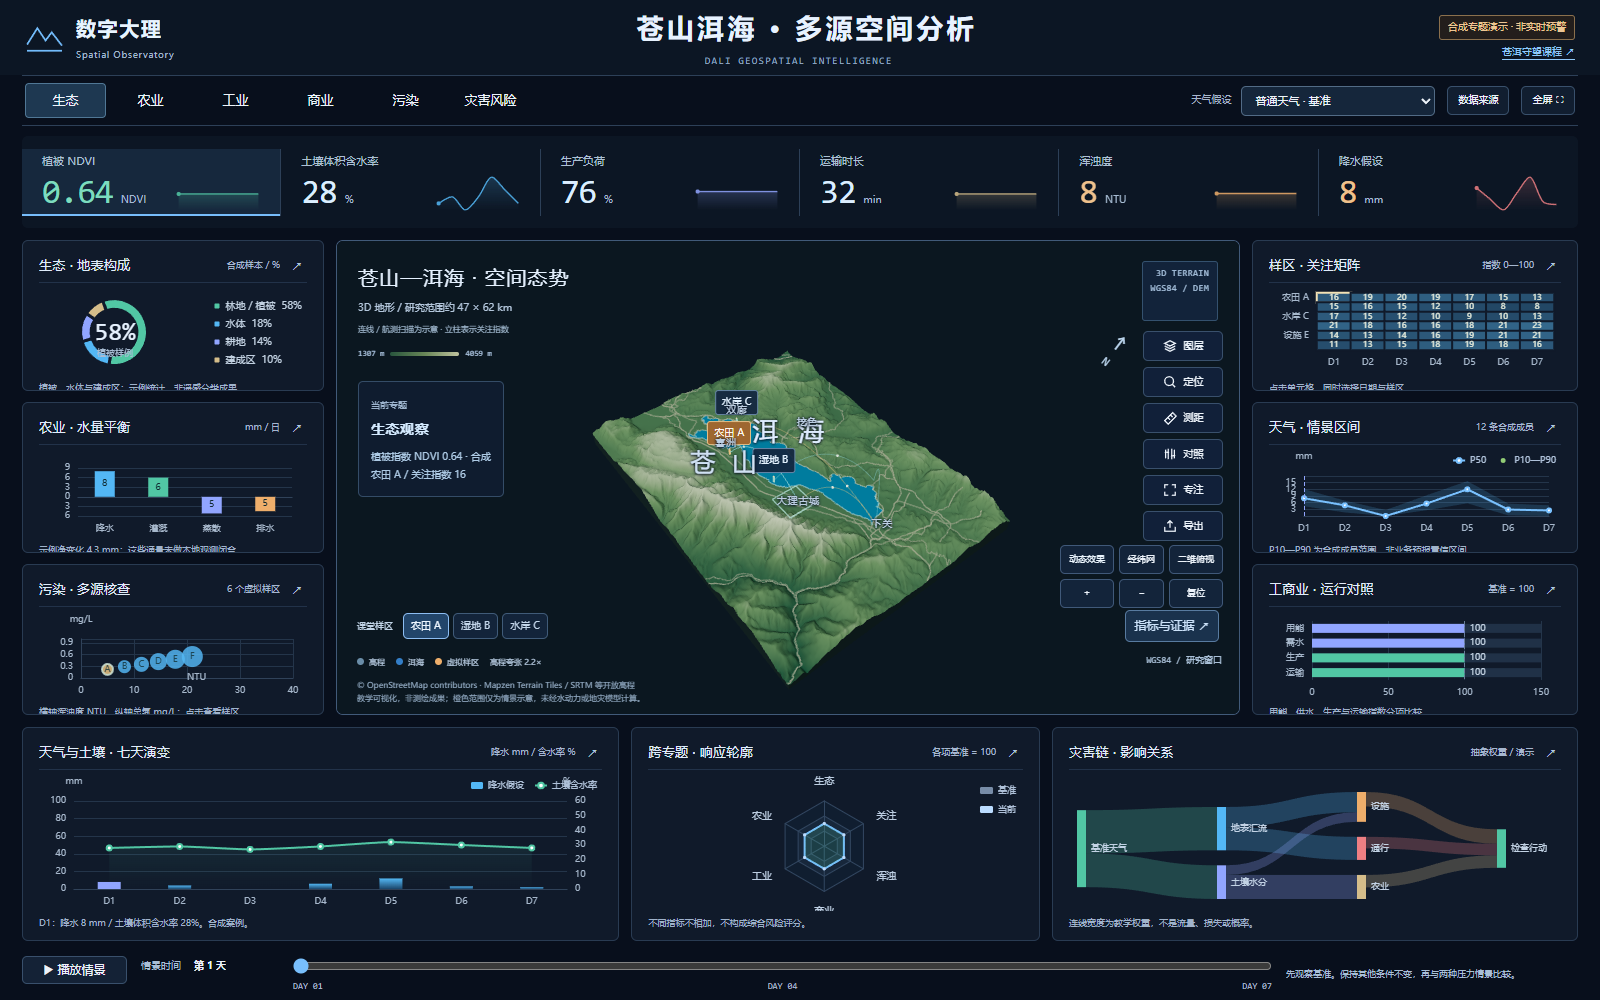
There are already twelve lessons, two workshops, research protocols, and student worksheets; these courses revolve around observation, measurement, discussion, and creation. Digital Dali places 3D terrain, layers, and scenario comparison on the same interface. Using the tools in class does not mean real-time weather has been accessed, local prediction models have been trained, or Box device integration has been completed.
Geography uses open elevation and OSM lake shore and road data, displayed with sampling and elevation exaggeration; thematic values, sample areas, and weather sequences are for instructional synthesis. It can help ask questions and compare hypotheses, but cannot provide real inundation depth, debris flow probability, or safety judgments for real locations. The source button on the map preserves these distinctions.
Future studies of field and historical data still need to determine observation, prediction timing, controls, and outcome variables. Climate background, weather events, and specific losses should be discussed separately; a single event cannot directly be used as a long-term attribution conclusion.
Four people, can also start from the same place
Someone observes the users, someone records conditions, someone organizes data, someone handles the tasks; rotate roles and check each other. Today you can first watch the demonstration and ask questions without having to immediately decide on a project.
Data sources
This page introduces AHALab's course design and related projects. Urban Cool Island provides classroom interactive exercises; Digital Dali illustrates the relationship between terrain, scenarios, and specific needs through interface screenshots.
Weather data see Original sources; Digital Dali's geographic sources see Project introduction. The teaching simulations in the chart and the on-site measurements should be understood separately.